

This blog provides a detailed explanation of the “Large Bearish Candlestick” (or “Large Down Candle“), a crucial component of technical analysis. It’s packed with useful information for trading, including the basic concept of this candlestick pattern, its variations, trends based on its appearance, and how to combine it with other indicators. By mastering the knowledge of the large bearish candlestick—essential for interpreting candlestick charts—you can sharpen your ability to accurately gauge market movements.
- 1 1. Basics of the Large Bearish Candlestick
- 2 2. Types of Large Bearish Candlesticks
- 3 3. Large Bearish Candlestick Appearance and Trends
- 4 4. Combining the Large Bearish Candlestick with Other Technical Indicators
- 5 5. Trading Strategies Based on the Large Bearish Candlestick
- 6 Summary
- 7 Frequently Asked Questions
1. Basics of the Large Bearish Candlestick
What is a Large Bearish Candlestick?
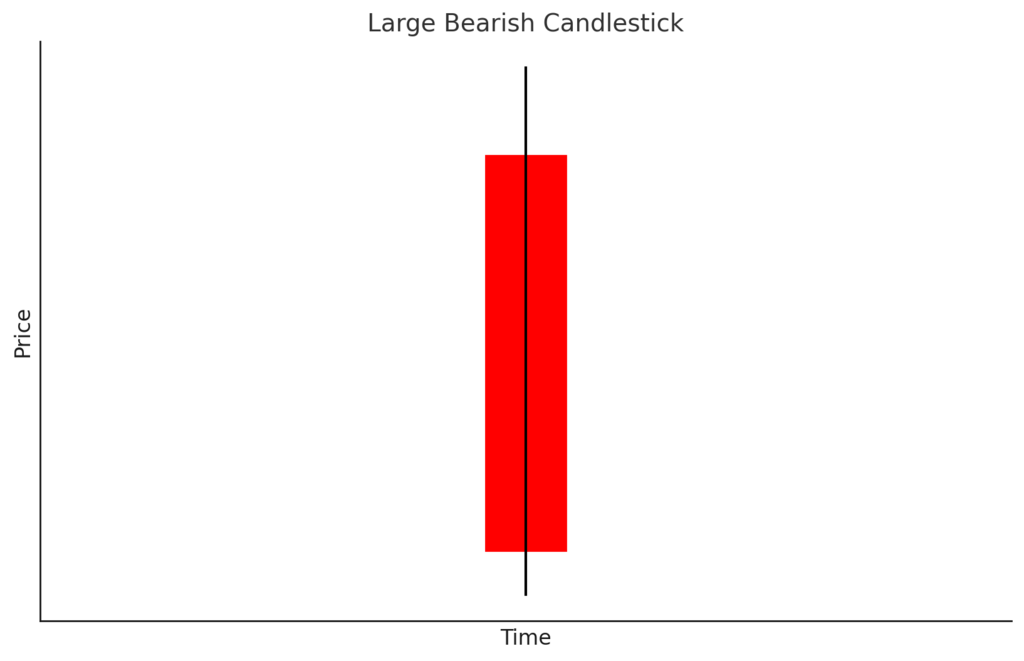
A large bearish candlestick is one of the most important bearish signals on a candlestick chart. This pattern is characterized by a long body, where the closing price is significantly lower than the opening price. It suggests strong selling pressure and indicates a high probability of further price decline.
How a Large Bearish Candlestick is Formed
The following conditions are necessary for a large bearish candlestick to form:
- Large Body: The body of the candlestick is noticeably larger compared to previous candles.
- Short Lower Shadow: The lower shadow should be as short as possible, or ideally, non-existent.
A large bearish candlestick that meets these conditions indicates strong selling momentum and can be a potential turning point in a trend.
The Psychology Behind a Large Bearish Candlestick
A large bearish candlestick doesn’t just show that the price has dropped; it also reflects the psychology of market participants. Specifically, the following psychological factors are often at play:
- Fear: Investors selling off their positions can cause a snowball effect, leading to further price drops.
- Selling Pressure: The appearance of a large bearish candlestick can trigger profit-taking or stop-loss orders, creating significant selling pressure.
The Importance of a Large Bearish Candlestick
A large bearish candlestick is a highly valuable candlestick pattern that indicates the strength of a trend or a potential reversal. When it appears in a downtrend, it often increases the likelihood of further declines and is commonly used as a reference for trading decisions. Its reliability is enhanced when combined with other chart patterns and technical indicators.
Summary
The large bearish candlestick plays a crucial role in investment decisions. Characterized by a large body and a short lower shadow, it reflects selling pressure and market sentiment, providing valuable clues about future market movements.

2. Types of Large Bearish Candlesticks
The large bearish candlestick is a type of candlestick that symbolizes strong selling pressure in the market, and it comes in various forms. Here, we’ll explain four main types based on their characteristics.
2.1 Standard Large Bearish Candlestick
A basic large bearish candlestick has a body that is significantly larger than other bearish candles, clearly indicating strong selling pressure. When this pattern forms, further price declines are expected. Its impact is even stronger when its body size is notably prominent compared to previous candles.
2.2 Small Bearish Candlestick
A small bearish candlestick has a short body and wicks, indicating uncertainty in the market. It reflects a situation where selling and buying forces are in a fierce struggle, making it difficult to predict future price movements. This shape suggests that the market might be on the verge of a change.
2.3 Large Bearish Candlestick with a Long Lower Shadow
Also known as a “Hammer,” this pattern is a large bearish candlestick with a long lower shadow. It appears when there was strong selling pressure initially, but then buyers stepped in, creating support. When this pattern appears in a high-price range, it suggests that sellers are dominant, and a downtrend may continue. However, if it appears in a low-price range, it can be a sign of a buyer rebound, potentially halting the price decline.
2.4 Bearish Candlestick with a Long Upper Shadow
This pattern, also known as a “Shooting Star” or “Inverted Hammer,” is a bearish candlestick with a long upper shadow. While sellers are dominant, it shows strong resistance from buyers. When this pattern is seen in a low-price range, it can indicate that buying momentum is strengthening and the market might rise. Conversely, when it appears in a high-price range, it suggests that selling pressure is intensifying, and it could be a precursor to further price declines.
2.5 Conclusion
Large bearish candlesticks come in a variety of types, each indicating different market psychologies and trends. Understanding these variations and analyzing them based on the appropriate market conditions allows you to build effective trading strategies.

3. Large Bearish Candlestick Appearance and Trends
The large bearish candlestick’s meaning can change significantly depending on where it appears on the chart, not just its shape. Here, we’ll take a closer look at the main locations where a large bearish candlestick appears and the trends associated with them.
Large Bearish Candlestick in a High-Price Range
When a large bearish candlestick appears in a high-price range, it’s considered a very important signal. This situation indicates that selling momentum has become strong, and it suggests the possibility of further price declines. A powerful selling pressure is created as market participants try to take profits.
Case Study: Large Bearish Candlestick in a High-Price Range
- Market Situation: A large bearish candlestick appears at the end of an uptrend, after breaking through a previous high.
- Implication: As buyers take profits and sellers take aggressive action, the market is highly likely to reverse.
Large Bearish Candlestick in a Low-Price Range
A large bearish candlestick in a low-price range also suggests a notable change in trend. In this case, while selling pressure increases, buyers may show strong resistance. This can be considered one of the market’s turning points.
Interpreting a Low-Price Range Candlestick
- Situation Analysis: When a large bearish candlestick appears in a low-price range, it’s crucial to observe how investors are reacting to past price levels.
- Investment Decision: It’s essential to grasp both the potential for a shift to buying and the risk of further declines.
Consecutive Large Bearish Candlesticks
When large bearish candlesticks appear consecutively, it is believed that the market’s selling pressure is extremely high, and the phenomenon known as a “Three Black Crows” (a series of three large bearish candlesticks) is particularly noteworthy. This pattern is often seen as a bottom signal, indicating that the market has completed a selling cycle.
Analyzing Consecutive Large Bearish Candlesticks
- Trend Continuation: Consecutive large bearish candlesticks are especially important in a downtrend, and while further declines are expected, it’s vital not to miss the timing for a potential rebound.
- Market Cooling Period: A cooling-off period often follows a series of large bearish candlesticks, making it essential to analyze market conditions and news during this time.
Relationship Between a Large Bearish Candlestick and Volume
When a large bearish candlestick appears, it’s also important to check the trading volume. A large bearish candlestick with high volume indicates that the signal is more reliable. Since the balance between sellers and buyers is significantly disrupted, it suggests a strong push in a particular market direction.
Volume Checkpoints
- Decline in Buying Pressure: When volume increases along with a large bearish candlestick, it suggests that market participants are supporting the downtrend.
- Reaction at Key Levels: The significance of a large bearish candlestick appearing near an important support or resistance line must be interpreted with extra care.
By understanding where large bearish candlesticks appear and the trends they signal, you can improve your trading judgment. It’s crucial to always pay attention to market movements and analyze them in combination with other technical indicators.
4. Combining the Large Bearish Candlestick with Other Technical Indicators
Large Bearish Candlestick and Moving Averages
To make the selling pressure indicated by a large bearish candlestick clearer, it’s effective to use moving averages. For example, when a large bearish candlestick appears with the price below the moving average, a continued downtrend is expected. A strong sell signal is present, especially when both short-term and long-term moving averages are simultaneously declining.
Large Bearish Candlestick and RSI (Relative Strength Index)
Next, let’s consider the approach using the RSI. If the RSI falls sharply from above 70 and a large bearish candlestick appears, it indicates that selling pressure has intensified after a period of being overbought. In this case, if the RSI falls below 50, the possibility of further decline increases. Conversely, when a large bearish candlestick appears with the RSI below 30, a potential rebound should also be considered.
Large Bearish Candlestick and Bollinger Bands
The combination with Bollinger Bands is also very effective. When the price reaches the upper band and a large bearish candlestick forms, it can be seen as a sign of reversal. In situations where the band width is narrowing, it indicates that the market is under high tension, and a sudden movement should be watched for.
Large Bearish Candlestick and Fibonacci Retracement
By combining the Fibonacci retracement with a large bearish candlestick, you can identify important support lines. When a large bearish candlestick appears at a Fibonacci retracement level (e.g., 61.8% or 78.6%), it increases the possibility that this level will become a strong reversal point. In this scenario, further declines may be expected before the price rises again.
Large Bearish Candlestick and Strong Support/Resistance
When a large bearish candlestick approaches an important support or resistance level, the subsequent price movement can change. If a large bearish candlestick appears while attempting to break through resistance, it further emphasizes that selling pressure is dominant, increasing the possibility of further decline. At these price levels, it’s also important to confirm other indicators.
Conclusion
By using these technical indicators, it becomes possible to decide on a trading strategy with higher accuracy when a large bearish candlestick appears. Since a single large bearish candlestick has its limitations, combining it with these indicators is crucial for deepening your understanding of market movements.
5. Trading Strategies Based on the Large Bearish Candlestick
The large bearish candlestick carries an important signal in the market. By using it, traders can build more effective trading strategies. Here, we’ll explain trading methods based on the large bearish candlestick.
5.1 Understanding Market Conditions
In trading based on the large bearish candlestick, it is crucial to correctly understand the market trend. When a large bearish candlestick appears, it’s important to analyze the market situation by paying attention to the following points:
- Confirm the Trend: When a large bearish candlestick appears during an uptrend, it is highly likely to suggest a trend reversal. Conversely, when it appears during a downtrend, it often signifies a further decline.
- Check the Volume: The trading volume at the time a large bearish candlestick is formed is also important. A large bearish candlestick with high volume indicates strong selling pressure, suggesting that the change in momentum is likely to be confirmed.
5.2 Determining Entry Timing
Next, let’s consider how to determine the entry timing based on the large bearish candlestick.
5.2.1 Using it as a Resistance Level
After a large bearish candlestick appears, it can act as a resistance zone. Therefore, the following method is effective:
- Aim for a Retracement: If the price shows a bounce after a large bearish candlestick appears, you can consider a “pullback sell” rather than a dip buy. Specifically, if the bounce occurs near the high of the large bearish candlestick, it can be a good opportunity for a sell entry.
5.2.2 Using Fake Setups
The large bearish candlestick and subsequent price movements can sometimes form a fake setup.
- Observe Price Movements: Observe the movement of the next few candlesticks after the large bearish candlestick (especially if bullish candles follow) to look for a potential trend reversal. This makes it easier to determine the entry timing.
5.3 Stop-Loss and Take-Profit
In trading based on the large bearish candlestick, setting stop-loss and take-profit points is also important.
5.3.1 Setting the Stop-Loss
- If it exceeds the high of the large bearish candlestick: If the price moves above the high of the large bearish candlestick after entry, consider a stop-loss. Breaking this high is often interpreted as a reversal sign.
5.3.2 Timing for Take-Profit
- Considering support lines: When the price movement after a large bearish candlestick approaches a support line, it’s advisable to take profits. This is because the market may temporarily rebound.
5.4 Combining with Other Signals
By combining the large bearish candlestick with other technical indicators, you can further increase your win rate.
- Coordination with Moving Averages: When a large bearish candlestick occurs near a moving average, it can be seen as a stronger signal of selling pressure. The crossing of short-term and long-term moving averages can confirm a trend reversal.
5.5 Precautions for Increasing Accuracy
In trading using a large bearish candlestick, it’s always important to be aware of the following precautions:
- Pay Attention to Wick Length: If the lower shadow of a large bearish candlestick is very long, it suggests indecision. Therefore, caution is required when determining the entry timing.
- Check Market Conditions: Since the market is easily influenced by news and economic indicators, always remember to check the latest economic news and market sentiment when trading.

Summary
The large bearish candlestick is a distinctive candlestick pattern that provides important market signals. By understanding its shape, its location on the chart, and its relationship with other technical indicators, traders can more accurately gauge market psychology and trends. Trading strategies based on the large bearish candlestick can help with appropriate entries and risk management during periods of increased selling pressure. However, it’s crucial to combine it with various analytical perspectives rather than relying on a single indicator. When using the large bearish candlestick in your trading, carefully observing market movements and having a flexible judgment will be key to success.
Frequently Asked Questions
What is a large bearish candlestick?
A large bearish candlestick is a type of bearish candlestick that serves as an important signal on a candlestick chart. It is characterized by a large body where the closing price is significantly lower than the opening price. It suggests strong selling pressure and is considered a sign that prices are likely to fall further.
What are the different variations of large bearish candlesticks?
Large bearish candlesticks come in several variations, including the standard large bearish candlestick, the small bearish candlestick, the large bearish candlestick with a long lower shadow (Hammer), and the bearish candlestick with a long upper shadow (Shooting Star). Each one indicates different market psychology and trends.
Where is it most important for a large bearish candlestick to appear?
When a large bearish candlestick appears in a high-price range, it indicates that selling momentum has strengthened, suggesting the possibility of further price declines. On the other hand, a large bearish candlestick in a low-price range can signal strong resistance from buyers and can be considered a turning point in the market.
How can I use a large bearish candlestick in combination with other technical indicators?
By combining a large bearish candlestick with technical indicators such as moving averages, RSI, Bollinger Bands, and Fibonacci retracement, you can interpret its meaning more accurately. This allows you to formulate a more effective trading strategy.