
1. What is an N-Wave?
1.1 Defining the N-Wave
The N-wave is a market pattern where prices move in an “up-down-up” or “down-up-down” sequence, recognized as part of the Elliott Wave Theory. It frequently appears in the middle of a trend and serves as a fundamental analysis technique for predicting future price movements. Often corresponding to the 3rd or 5th wave of Elliott Wave, it typically signals trend continuation.
1.2 Importance of N-Waves in Trading
Understanding N-waves is crucial for traders to predict market turning points and execute timely trades. Especially in the forex and stock markets, the N-shaped price pattern helps in determining trend sustainability and the direction of the next price fluctuation.

2. N-Wave Mechanics Explained
2.1 Ascending and Descending N-Waves
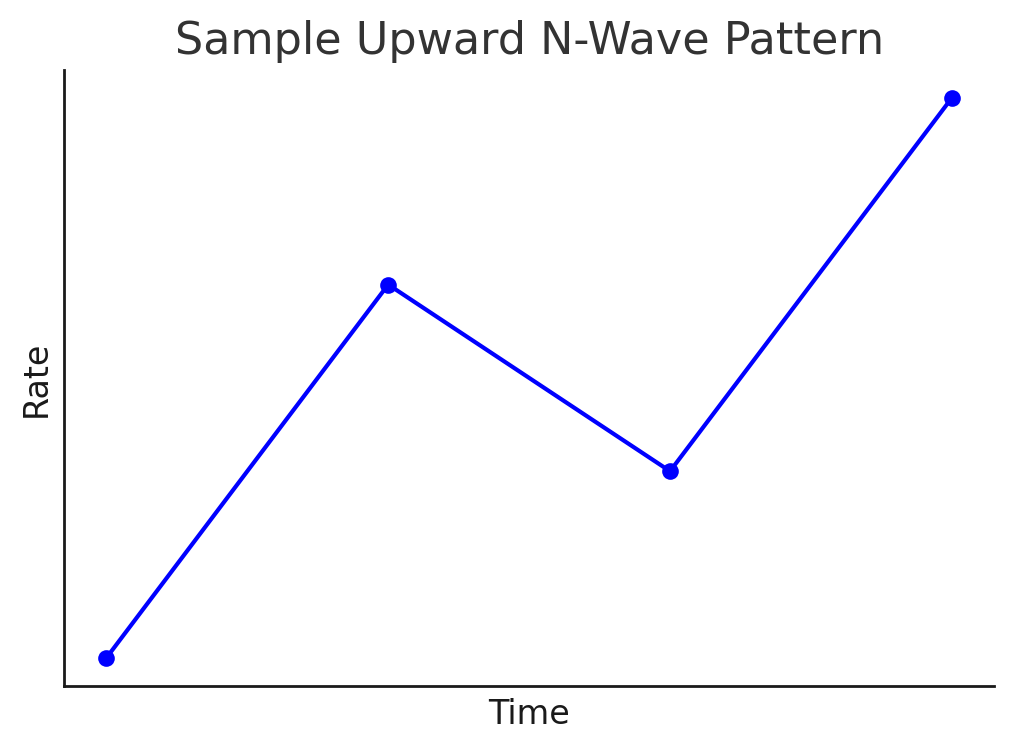
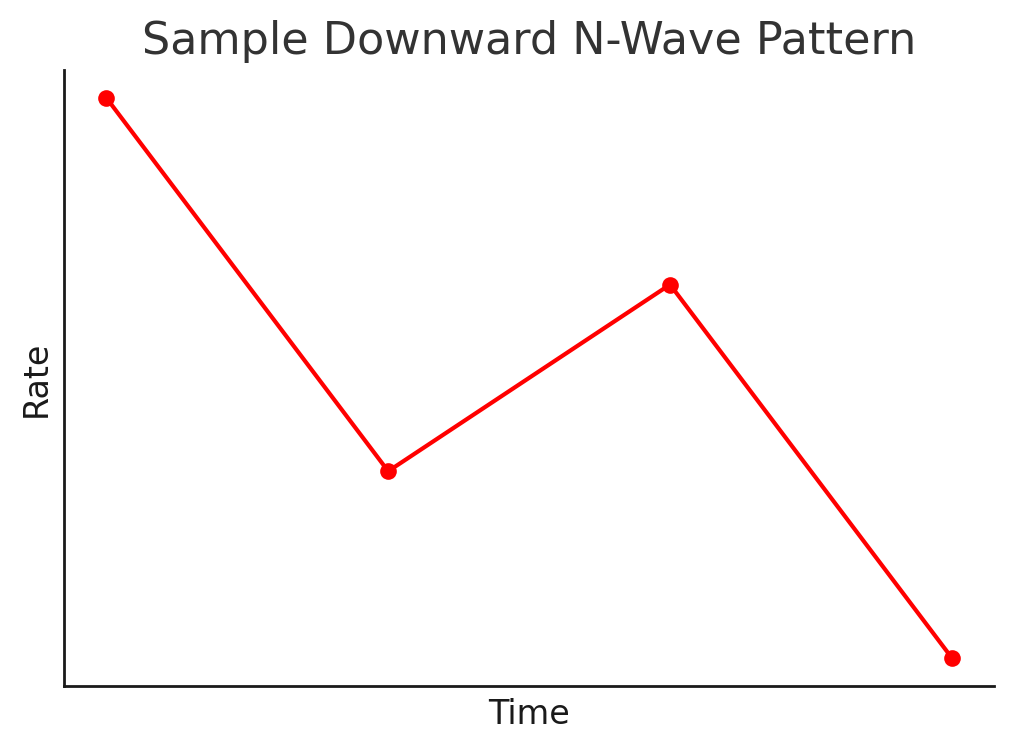
There are two types of N-waves: the **ascending N-wave**, where prices move “up-temporary pull back-up again,” and the **descending N-wave**, where prices move “down-temporary bounce-down again.” These appear in the middle of a trend and often indicate the direction of the subsequent trend.
2.2 N-Wave Formation Rules
Based on Elliott Wave principles, the second and fourth waves of an N-wave typically do not retrace completely to the start of the previous wave, usually staying within the 61.8% Fibonacci retracement level. This serves as a vital indicator for traders to confirm the continuation of a trend.
3. N-Wave Trading Strategies
3.1 Entry and Exit Timing with N-Waves
When an N-wave formation is confirmed, it’s recommended to enter a trade during the formation of the fourth wave, guided by Elliott Wave Theory. Utilizing Fibonacci retracement, entering at the 50% or 61.8% level and taking profit when the trend resumes its upward or downward movement is an effective strategy.
3.2 Setting Stop Losses for N-Wave Trades
When entering a trade during the fourth wave, setting the **stop loss** near the origin of the first wave can minimize risk. Furthermore, leveraging Fibonacci levels to cut losses at the appropriate time when a price reversal occurs is crucial.
4. N-Wave Scenarios and Considerations
4.1 Good vs. Bad N-Waves
A **good N-wave** consistently makes higher highs and higher lows (or lower lows and lower highs), with shallow pullbacks or bounces, indicating a strong trend. Conversely, if pullbacks are too deep or prices transition into a range-bound market, it’s considered a **bad N-wave**, increasing risk. Therefore, it’s recommended to use other technical indicators (e.g., RSI or MACD) in conjunction to confirm trend strength.
4.2 Market Volatility and N-Wave Formation
Stable market volatility is essential for clear N-wave formation. When volatility is too high, false N-waves can easily form, leading to misjudged entry timings.
5. N-Wave Comparison with Other Price Patterns
5.1 Differences from I, V, and P Waves
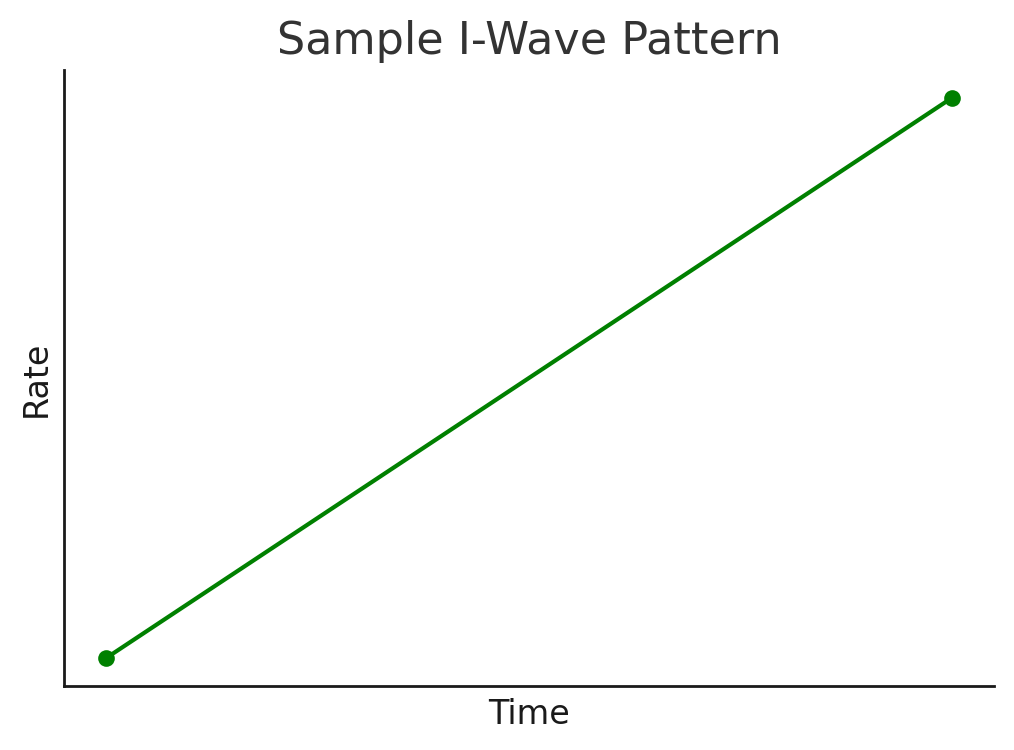
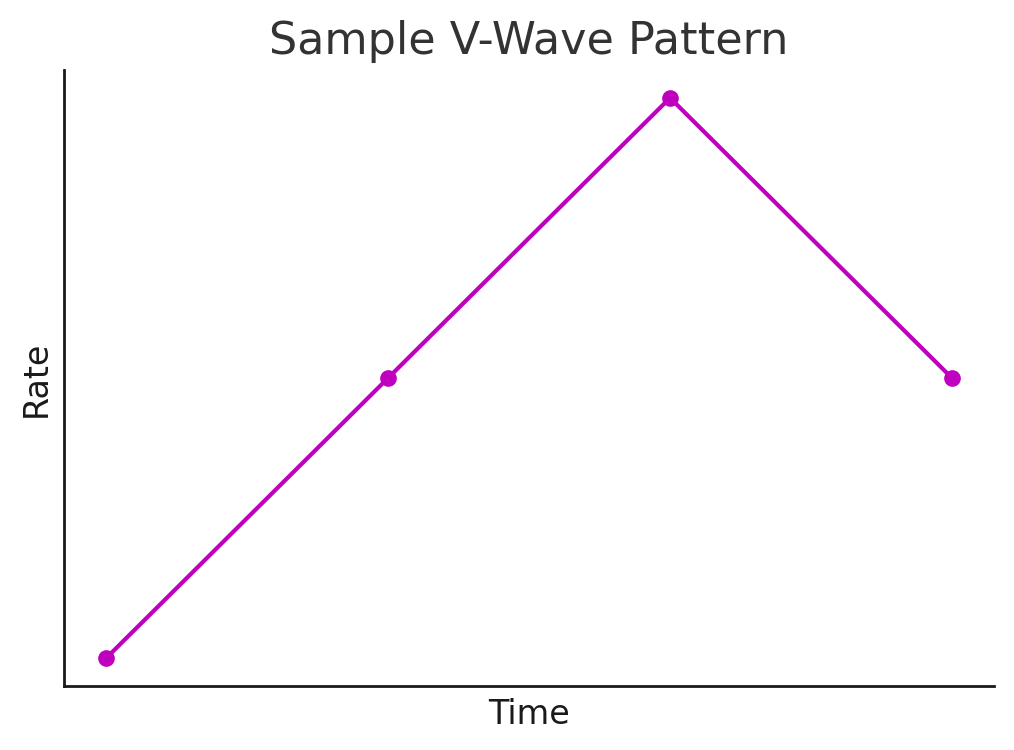
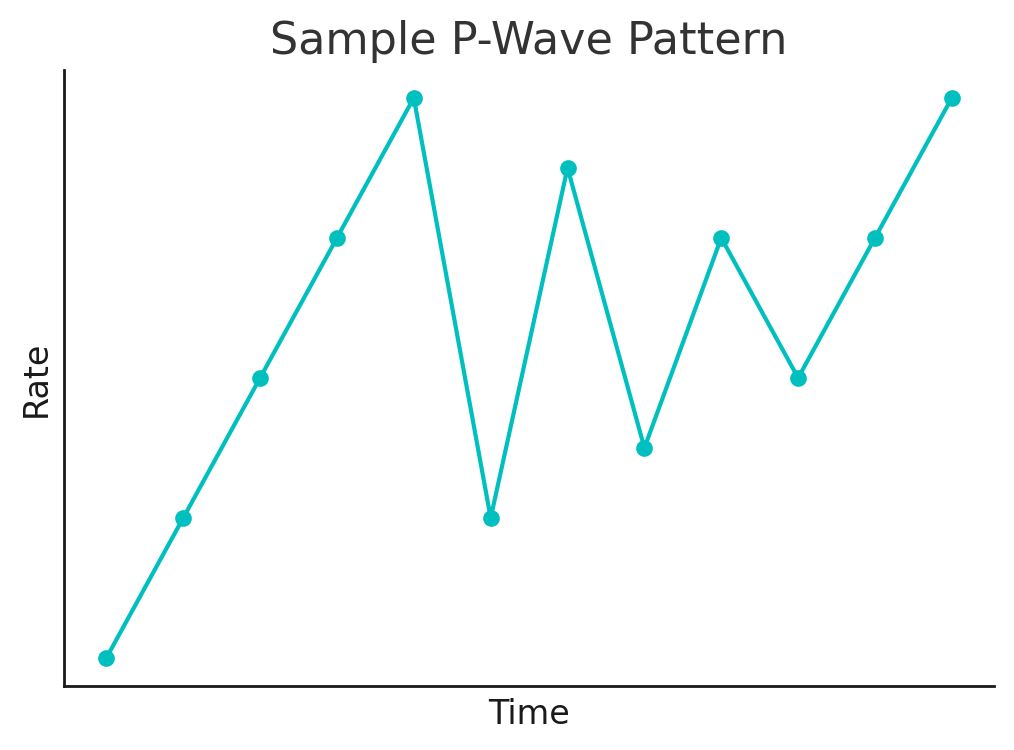
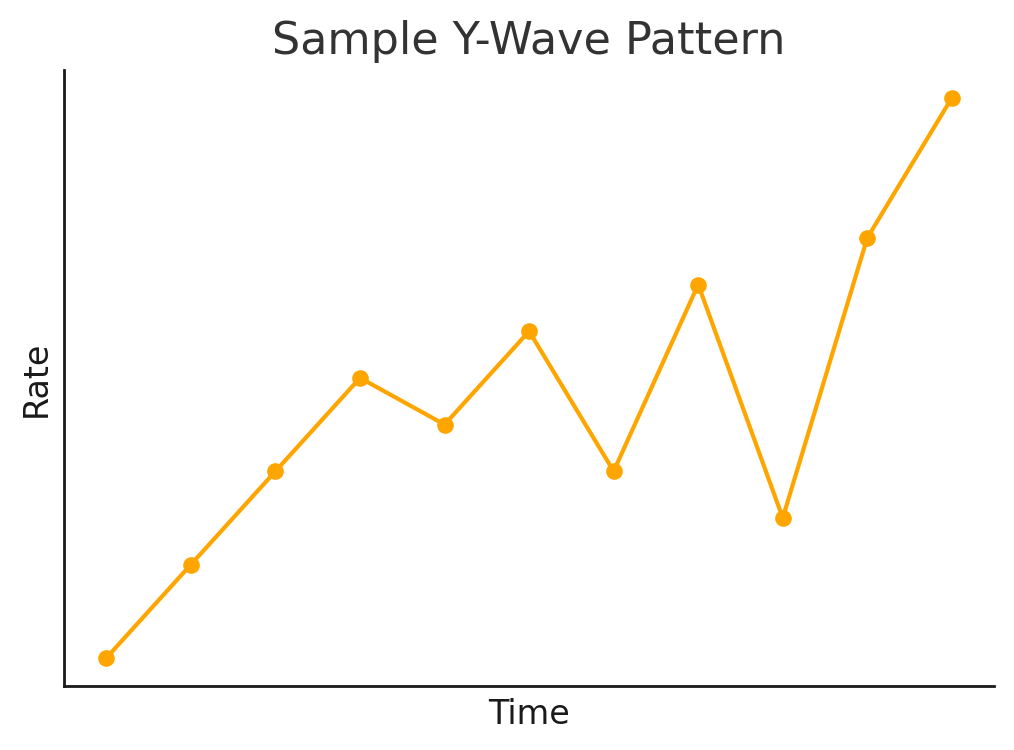
Unlike I-waves (straight upward or downward movements) or V-waves (sharp reversals), N-waves show a temporary reversal of the trend before resuming the original direction. While P-waves and Y-waves often indicate prices entering a range-bound market, N-waves play a particularly important role within trending markets.
6. Practical N-Wave Trading Examples
6.1 Successful N-Wave Trade Case Study
A past successful example involved an N-wave formation in the USD/JPY pair, where a trade was entered during the fourth wave using Fibonacci retracement and profit was taken at the fifth wave. This illustrates how N-waves are particularly effective for trading in the forex market.
6.2 Reading N-Waves on Real-Time Charts
On real-time charts, it’s effective to identify the formation of the first or third wave of an N-wave and then wait for the pullback of the fourth wave to enter. Additionally, using Elliott Wave indicators available in trading tools like MT4 and MT5 can help in identifying waves more easily.
7. N-Wave Frequently Asked Questions (FAQ)
7.1 Difficulty in Identifying N-Waves
If you find it challenging to spot N-waves, it’s recommended to use trend indicators such as moving averages, RSI, or MACD in conjunction. Since wave counting can sometimes be complex, utilizing appropriate tools and indicators can make it easier to discern trends.
7.2 Effective Use of Fibonacci Retracement with N-Waves
Fibonacci retracement is a crucial indicator for the second and fourth waves of an N-wave. When a trend is strong, the continuation of the trend can be expected as long as prices do not exceed the 61.8% level, making it useful for setting entry points and stop losses.

8. Conclusion and Next Steps
8.1 Reconfirming the Importance of N-Waves
N-waves are a fundamental tool for identifying market trends and predicting future movements. Their accuracy in trading can be significantly enhanced when combined with Elliott Wave Theory and Fibonacci retracement.
8.2 Applying N-Waves to Future Trading Strategies
To deepen your N-wave analysis and apply it to actual trades, effectively utilize trading tools and indicators. Combining multiple technical indicators will also enable more precise entries and exits.
References
N波動は主にテクニカル分析で使われる市場の価格パターンの一つです。このパターンを特定して解釈することで、トレーダーは情報…

金融コンサルティング会社アセンダントの代表取締役でもある山中康司氏による監修記事です。フィボナッチ・エクスパンションの使…