
This time, we’re introducing a blog that thoroughly explains “Harami Candlestick Patterns,” a crucial technical indicator in stock trading. By understanding the Harami pattern, you can identify stock price turning points and determine optimal buying and selling timings. This article carefully explains everything from the definition of the Harami pattern to its importance, how to identify it, and its relationship with stock prices. This blog is highly recommended for traders and anyone interested in investing.
- 1 1. What is a Harami Candlestick Pattern?
- 2 2. Importance of the Harami Candlestick Pattern
- 3 3. How to Identify the Harami Candlestick Pattern
- 4 4. Harami Candlestick Pattern and Stock Price Relationship
- 5 5. Real-World Examples of the Harami Candlestick Pattern
- 6 Summary
- 7 Frequently Asked Questions
- 8 References
1. What is a Harami Candlestick Pattern?
Definition of the Harami Candlestick Pattern
The Harami candlestick pattern is a specific candlestick pattern in stock and foreign exchange markets, primarily used by traders and investors to suggest a potential market reversal. This pattern consists of a **large bullish candlestick** (first day) followed by a **bearish candlestick** (second day), where the bearish candlestick’s real body is contained within the real body of the preceding bullish candlestick.
Pattern Composition
This pattern is formed by a large bullish candlestick followed by a smaller bearish candlestick. Specifically, it has the following characteristics:
- Appearance of a Large Bullish Candlestick: On the first day, a large bullish candlestick appears, indicating that the price significantly rose from the open to the close of trading.
- Appearance of a Bearish Candlestick: On the second day, a bearish candlestick appears, with its trading range contained within the real body of the bullish candlestick from the previous day, and closing below the previous day’s bullish close.
In this way, the second day’s bearish candlestick is “pregnant” (harami) within the first day’s bullish candlestick, hence the name “Harami Candlestick.”
Reflection of Market Psychology
The Harami candlestick pattern is said to reflect the psychology of market participants. The strong rise on the first day indicates buyers’ eagerness, but the bearish candlestick on the second day suggests an increase in selling pressure. Such a situation raises doubts about the sustainability of the uptrend, suggesting that a market correction or reversal may be imminent.
Importance of Trading Signals
When a Harami candlestick pattern appears, it is crucial to observe the market trend on the next day. In particular, the movement on the third day is a key factor in determining the subsequent trend. If the price rises on the next day, the uptrend may continue, but if the price falls, it suggests a potential reversal to a downtrend. This allows investors to flexibly adjust their buying and selling strategies.
Harami Candlestick Pattern and Technical Analysis
This pattern is one of the particularly noteworthy techniques in technical analysis. By making investment decisions based on the rules and the appearance of the pattern, you can seize opportunities for potential profit. The appearance of a Harami candlestick pattern, especially at high price levels, can be a signal that requires caution.


2. Importance of the Harami Candlestick Pattern
Market Reversal Sign
The Harami candlestick pattern is a very important candlestick pattern that suggests a market reversal. The appearance of this pattern, especially at **high price levels**, indicates the possibility of the market shifting from an uptrend to a downtrend. For this reason, traders pay close attention to this pattern as crucial information for deciding their next trading strategy.
Trading Decision Factor
The appearance of this pattern should not be used as a sole decision-making factor, but rather observed in conjunction with the price movement on the next day. The movement on the 3rd day after the Harami pattern is particularly important and is judged as follows:
- If the candle **closes with a bullish candlestick after opening higher**, this is considered evidence that the uptrend is still continuing, providing a further buying opportunity.
- If the candle **closes with a bearish candlestick after opening lower**, it is often interpreted as a sign of reversal and a selling signal.
Impact on Traders
Recognizing the Harami candlestick pattern is extremely important for traders. It has the following impacts:
Risk Management: When a Harami pattern appears, measures can be taken to reduce risk in the next day’s trade. Particularly upon confirming a sell signal, early position liquidation is often suggested.
Strategy Review: It serves as an opportunity to review trading strategies and helps determine when to enter and exit positions.
Psychological Approach: By recognizing the possibility of a market reversal, traders can make decisions calmly, helping them avoid emotional trading.
Economic Impact
The Harami candlestick pattern can suggest not only market trends but also broader economic impacts. Especially when significant news or events are affecting the market, the appearance of this pattern can change predictions for future economic indicators or corporate performance. Traders are required to collect and analyze this information to understand overall market trends.
3. How to Identify the Harami Candlestick Pattern
Definition of the Harami Candlestick Pattern
The Harami candlestick pattern refers to a specific two-bar candlestick pattern. This pattern has a shape where a large bullish candlestick is followed by a bearish candlestick on the next day, and that bearish candlestick’s real body is contained within the real body of the preceding large bullish candlestick. By the appearance of this pattern, it is possible to read a reversal signal hidden within an uptrend.
Steps to Identify
Confirm the Large Bullish Candlestick
First, check if a clear large bullish candlestick has formed on the day’s chart. A large bullish candlestick starts higher than the previous day’s close and ends with a significant rise.Appearance of a Bearish Candlestick
Confirm that the candlestick appearing on the next day is a bearish candlestick. This bearish candlestick must be contained within the real body of the large bullish candlestick formed on the previous day. This means that the bearish candlestick’s high must be lower than the bullish candlestick’s high, and the bearish candlestick’s low must be higher than the bullish candlestick’s low.Pattern Confirmation
Finally, confirm that these two candlesticks completely overlap. The Harami candlestick pattern is established when the inner bearish candlestick is contained within the outer large bullish candlestick.
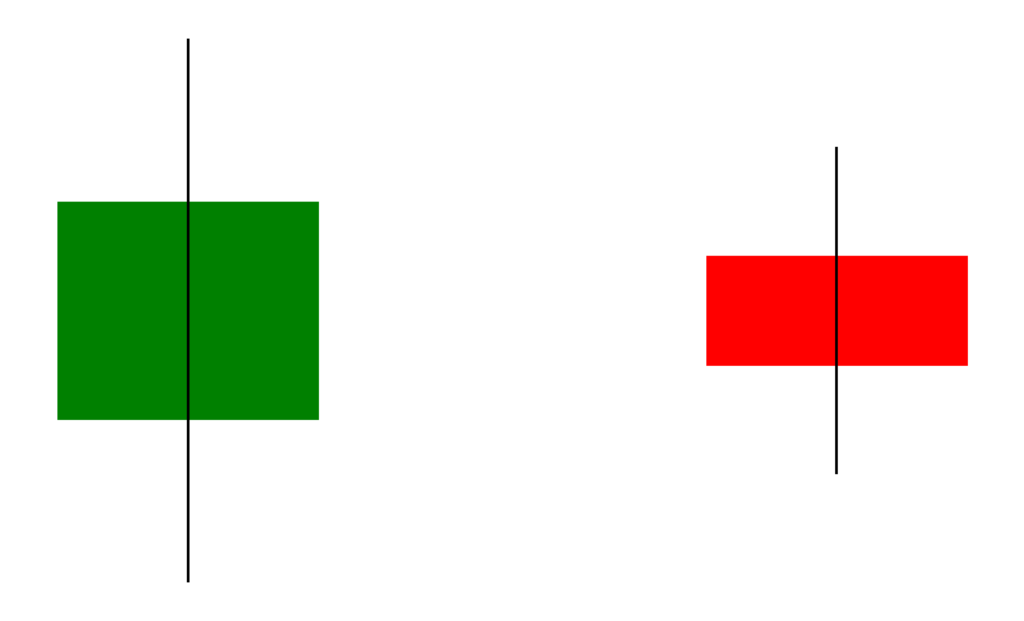
Understanding with Images
To understand the Harami candlestick pattern, it is effective to draw it on an actual chart. For example, by drawing a large bullish candlestick on the chart and then drawing a bearish candlestick that fits snugly next to it, you can visually grasp the characteristics of this pattern. Below is an example of the visualization of this pattern.
Trade Signal
If a Harami candlestick pattern is formed, a significant change in the market can be expected. Especially when this pattern is confirmed at high price levels in an uptrend, attention should be paid to the movement of the next day. If a bullish candlestick appears with an upward gap on the next day, it can be judged that the rise is continuing, but conversely, if a bearish candlestick appears with a downward gap, it may become a selling signal as a sign of reversal.
Cautionary Notes
The Harami candlestick pattern alone is not always a reliable sign of a trend reversal, so it is important to use it in combination with other technical indicators and market conditions. Additionally, by analyzing past charts, you can grasp the appearance patterns of the Harami candlestick and utilize them for future trading strategies.
4. Harami Candlestick Pattern and Stock Price Relationship
Mechanism of the Harami Candlestick Pattern
The Harami candlestick pattern serves as an important technical indicator, especially when stock prices are at high levels. This pattern appears with a large bullish candlestick first, followed by a bearish candlestick whose real body is contained within the real body of the preceding bullish candlestick. This movement suggests increasing selling pressure and indicates a potential turning point in the market. When a Harami pattern is formed, the market movement on the next day becomes key.
Stock Price Decline Signal
Specifically, if a Harami pattern appears at high price levels, and the next day opens lower and closes as a bearish candlestick, there is a risk that the market will gradually turn downwards. In this case, it can be an important sell signal for investors. Conversely, if a bullish candlestick appears with an upward gap after a Harami pattern, it can be judged that the uptrend will continue.
Understanding Selling Conditions
There are several conditions for the appearance of a Harami candlestick pattern. First, the market must be in an uptrend. Second, a large bullish candlestick appears on the first day, and a bearish candlestick is formed on the next day. Then, if the market on the next day opens lower and closes as a bearish candlestick, this is the timing for selling. By understanding this sequence of events, more strategic buying and selling becomes possible.
Market Influence
The Harami pattern is merely one pattern, and it is important to use it in conjunction with other technical indicators and fundamentals to assess overall market movements. However, investors who understand this pattern can gain an important tool to maximize profits from short-term price fluctuations.
Implied Risks
Additionally, the Harami candlestick pattern does not necessarily trigger a sharp market decline. There are cases where further upward movement is observed even after this pattern is formed. Therefore, once a Harami pattern is identified, close attention must be paid to subsequent market trends, and risk management is essential when trading.
5. Real-World Examples of the Harami Candlestick Pattern
Case of Sundrug in December 2022
In late December 2022, a “Harami Candlestick” pattern was observed on Sundrug’s stock price chart. This pattern appeared at high price levels in an uptrend, initially showing a large bullish candlestick, followed by a bearish candlestick on the next day, with its real body contained within the real body of the previous day’s large bullish candlestick. At this time, the stock price maintained a bullish mood but entered a cautious phase.
- Day 1: A large bullish candlestick formed, and the stock price rose actively.
- Day 2: A bearish candlestick appeared and closed within the range of the large bullish candlestick, thus recognized as a “Harami Candlestick.”
After this, the stock price turned downwards, and a significant correction was observed several business days later. In this case, the Harami pattern demonstrated its function as a strong sell signal.
Case of Kawasaki Heavy Industries
Conversely, a “Harami Candlestick” was also found in Kawasaki Heavy Industries’ chart, but a somewhat different result was observed here. After the Harami pattern occurred, the stock price continued to decline.
- Day 1: There was momentum with a large bullish candlestick, but
- Day 2: A bearish candlestick appeared, but it continued to show further decline thereafter.
This pattern, a “Harami Candlestick” at lower price levels, did not show the expected rebound and instead resulted in weak movement contrary to expectations of an uptrend. This example provides an important lesson that an upward movement is not always expected from a “Harami Candlestick.”
Cautionary Notes
When a Harami candlestick pattern appears, it is crucial to observe the market on the following day. Since the Harami pattern alone is not enough to determine the future of the market, it is important to combine it with other technical indicators and chart patterns for judgment.
As seen from actual charts, while the “Harami Candlestick” is a clear signal, the results can often vary depending on past trends and market conditions, requiring a cautious approach.

Summary
The Harami candlestick pattern is a technical analysis technique that holds significant meaning at high price levels in an uptrend. When this pattern appears, attention must be paid to the movement of the following day. However, relying solely on this pattern carries high uncertainty; it’s crucial to combine it with other indicators for comprehensive analysis. While the Harami pattern provides a clear signal, results can vary depending on market conditions, requiring careful consideration and flexible trading decisions. Investors should always respond quickly to market changes and strengthen risk management to effectively utilize this technique.
Frequently Asked Questions
What kind of pattern is the Harami Candlestick?
The Harami candlestick pattern refers to a pattern where a large bullish candlestick is followed by a small bearish candlestick, with the bearish candlestick’s real body contained within the real body of the preceding bullish candlestick. This suggests a reversal signal within an uptrend.
What is the meaning of the Harami Candlestick pattern?
The Harami candlestick pattern is an important pattern that suggests a market reversal. Especially when it appears at high price levels, attention should be paid to the next day’s movement: if it opens higher and forms a bullish candlestick, the uptrend may continue, but if it opens lower and forms a bearish candlestick, it is considered a sign of reversal. Traders use this pattern as a crucial element for strategy formulation.
How can I identify the Harami Candlestick pattern?
To identify the Harami candlestick pattern, three steps are necessary: first, confirming a large bullish candlestick; second, the appearance of a bearish candlestick on the next day; and third, ensuring the bearish candlestick is contained within the real body of the bullish candlestick. When these conditions are met, it can be identified as a Harami candlestick pattern.
Are there any real-world examples in stock charts?
For example, a Harami candlestick pattern was observed in Sundrug’s stock price in December 2022, followed by a significant correction. On the other hand, in the case of Kawasaki Heavy Industries, despite a Harami pattern being observed, the stock continued to decline afterward. Thus, the Harami pattern is not always a reliable reversal signal and should be judged in conjunction with other indicators.
References
包み足(アウトサイドバー)とはらみ足(インサイドバー)は、2本のローソク足を組み合わせた形状のことです。本記事では、包み…