What is a Range Market? Understanding the Basics
In financial markets, prices are constantly fluctuating, and the patterns of those fluctuations are diverse. Among them, a range market indicates a relatively calm situation where prices repeatedly move up and down within a specific price band. Understanding and appropriately responding to this market is crucial for earning profits while managing risk. A range market is formed by a complex interplay of market participants’ psychology, economic conditions, and technical factors. It can be described as a state where the market loses directional bias and buying and selling forces are in equilibrium. By grasping this state and developing effective trading strategies, opportunities to profit from the market expand.
Definition and Characteristics of a Range Market
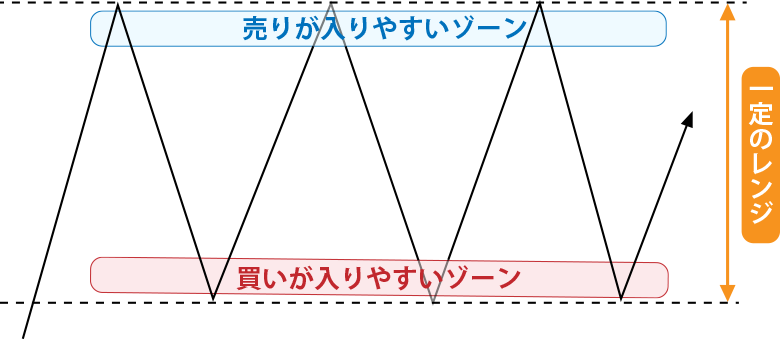
A range market refers to a situation where prices repeatedly oscillate within a fixed range. It is characterized by the absence of a clear trend, with prices staying within a defined band. This band is defined by a support line (lower boundary) and a resistance line (upper boundary). The typical pattern of a range market is the price moving back and forth between these lines. As the price approaches the upper limit, selling pressure increases; as it nears the lower limit, buying pressure strengthens, causing the price to remain within the range. This market is formed by various factors such as participants’ psychology and economic indicator releases, and its duration can span from a few hours to several weeks, or even months in some cases.
Reasons Why a Range Market Occurs
It tends to arise when buying and selling forces are balanced. It appears in situations where prices are reluctant to move significantly, such as when traders are waiting or before major economic indicator releases. Additionally, a range market can form when participants hold divergent views on the price. For example, if buying dominates in one price band while selling dominates in another, the price will oscillate within a fixed range. Moreover, when the entire market is awaiting specific news or events, that is another reason a range market can develop. Because participants refrain from active trading, the price remains confined to small fluctuations.
Differences Between Range and Trend Markets
A trend market is a situation where prices move unilaterally upward or downward. It is characterized by a clear uptrend or downtrend, with prices continuing in one direction. In contrast, a range market has a small price swing and repeatedly stays within a fixed band. Therefore, in a trend market, it is common to trade in line with the trend direction, whereas in a range market, trades that target price reversals are considered effective. Trend markets tend to arise when the market has a clear direction and are heavily influenced by economic factors and news. Conversely, range markets are more likely to occur when the market lacks direction and participants hold conflicting views. Thus, selecting the appropriate trading strategy based on market conditions is key to generating profits.
The concept of a range market has evolved alongside the history of technical analysis. In the late 19th and early 20th centuries, Charles Dow’s Dow Theory emphasized market trends while also addressing situations without a clear trend, such as range markets. Since then, various technical analysis methods have been developed, advancing the analysis of range markets. In particular, the establishment of support and resistance line concepts clarified range market analysis. Today, a variety of tools and indicators are available to help identify range markets and devise trading strategies.
For a concrete example, consider a stock market where a company’s share price stays within a specific range (for instance, between ¥1,000 and ¥1,050) for several weeks. In this case, ¥1,000 serves as the support line and ¥1,050 as the resistance line. The price repeatedly rises toward the support and falls toward the resistance, creating a range market. Similarly, in the foreign exchange market, a currency pair may continue to fluctuate within a fixed band. For example, if the EUR/USD trades between 1.1000 and 1.1100, that is also a range market. These examples illustrate that range markets are a common phenomenon across various markets, and by responding appropriately, traders can seek profits.

How to Identify and Analyze Range Trading
Using Support and Resistance Lines
Range trading moves within a price band bounded by two lines: support and resistance. The support line often acts as a floor when prices decline, while the resistance line tends to be a ceiling when prices rise. By understanding these lines, you can pinpoint entry and exit timing. For example, you might buy near the support line and sell near the resistance line. These lines can be somewhat predicted by analyzing past price movements, but perfect accuracy is impossible, and you must always consider the possibility of a false breakout. To increase reliability, it’s important to confirm the lines across multiple timeframes and combine them with other technical indicators.
Analysis Using Technical Indicators
You can analyze range trading using technical indicators such as Bollinger Bands, RSI, and moving averages. Bollinger Bands indicate price volatility; a narrowing band suggests a range‑bound market. RSI signals overbought or oversold conditions, and in a range market it tends to oscillate within a specific band. Moving averages show the average price movement, and in a range market prices often trade between the moving average and its opposite side. Combining these indicators can yield more precise analysis. For instance, if RSI signals overbought and the price is approaching the upper Bollinger Band, that can justify a sell entry. Technical indicators should be used as supplementary tools, and overconfidence is a danger.
OANDA’s Market Open Range Strategy Indicator
Using OANDA’s Market Open Range Strategy Indicator makes it easier to grasp the range during specific time periods. The indicator automatically displays the price range for a given time slot, allowing you to visually confirm the formation of a range market. In particular, ranges tend to form right after the market opens or during certain periods, so leveraging this indicator can help you devise effective trading strategies. The indicator can also analyze the width and frequency of ranges based on historical data, enabling more precise range analysis and improving trade accuracy. However, the indicator should be viewed as just one reference point, and it’s important to combine it with other analytical methods.
Many well‑known traders and analysts achieve stable profits by effectively utilizing range markets. For instance, a veteran trader says, “A range market indicates that the market is temporarily in equilibrium. By understanding this state and trading cautiously, you can reduce risk while earning profits.” A technical analyst adds, “It’s essential to grasp support and resistance lines in a range market. By identifying these lines and entering and exiting at the right times, you can maintain a high win rate.” These experts’ insights are highly valuable for mastering range trading. Drawing on their experience and knowledge is crucial for refining your own trading strategy.
Effective Trading Strategies in Range Markets
Contrarian Strategy in Range Markets
In range markets, a contrarian strategy of buying at the support line and selling at the resistance line is effective. You trade by timing when the price reverses within the range. Specifically, you enter a buy when the price approaches the support line, and enter a sell when the price approaches the resistance line. This strategy is based on the premise that the range market stays within a fixed range, and that the price is likely to reverse when it reaches the line. However, since a range market always has the potential to break out, it is important to set a firm stop‑loss line. Also, the contrarian strategy carries a high risk of loss when the range market is in its final stages or when a breakout is imminent, so caution is needed.
Trend‑Following Strategy Targeting Range Breakouts
When the price breaks out of a range market, it can also be effective to enter in the direction of the breakout with a trend‑following approach. A breakout can signal the end of the range market and the start of a new trend. Therefore, the trend‑following strategy is to buy when the price breaks above the resistance line and to sell when it breaks below the support line. However, you must also consider the possibility that the breakout is a false signal. To confirm a genuine breakout, you need to check for increased volume and price movement. It is also important to monitor the price after the breakout and to take profits or cut losses promptly. The trend‑following strategy can capture large profits if it successfully captures a trend emerging from a range market, but you must understand that it carries risk.
Using Automated Trading
Some brokerage firms, such as Matsui Securities, provide automated trading tools. By setting up an automated trading strategy specialized for range markets, you can trade more efficiently. Automated trading tools execute trades automatically based on pre‑set rules, so you no longer need to constantly monitor the chart. For a range‑market‑specific automated strategy, you can set it to automatically enter and exit when the price reverses between the support and resistance lines, or to automatically enter when a range breakout occurs. Using automated trading tools allows you to trade in a disciplined, emotion‑free manner. However, automated tools are not foolproof; depending on market conditions, they can still incur losses, so it is important to review the settings regularly.
When devising a trading strategy for range markets, there are several points to keep in mind. First, remember that a range market will eventually break out. Therefore, it is important to always set a stop‑loss line and limit risk. Also, range markets are said to make it difficult to time profit‑taking compared to other market conditions. Thus, clearly define your profit‑taking target and avoid greed. Furthermore, range markets are prone to false breakouts, so you need to understand that. To avoid falling for a false breakout, combine multiple technical indicators and other analytical methods and make a comprehensive judgment.

Considerations in Range Trading
Beware of Fake Breakouts
In range trading, you must also consider the possibility that a breakout is a fake. Careful analysis and judgment are essential to identify a genuine breakout. A fake breakout is when the price appears to break out temporarily, only to quickly return to the original range. Getting caught in a fake breakout can lead to incorrect entries and potential losses. To avoid fake breakouts, you need to confirm breakouts carefully. Specifically, checking for increased volume and price momentum, and confirming with multiple technical indicators, is effective. Also, monitor the price movement after the breakout; if it quickly returns to the original range, it is important to cut losses. Fake breakouts are especially likely toward the end of a range or during periods with few market participants, so caution is warranted.
Strict Stop-Loss Discipline
In range trading, setting a stop-loss line and minimizing losses is essential. Especially to curb losses during a range breakout, enforce your stop-loss settings. A stop-loss line is typically set at a fixed price distance from the entry point. For example, if you enter a long position near a support line, set the stop-loss below that support line. By setting a stop-loss line, you can limit losses even if unexpected price movements occur. Also, decide on the stop-loss line in advance and avoid changing it during the trade. Changing the stop-loss line based on emotional decisions can lead to larger losses. Stop-losses are not only effective at reducing losses but also at easing mental stress.
Risk management in range trading is as important as the trading strategy itself. First, avoid putting all your capital into a single trade; aim for diversification. Also, setting too high a leverage increases the risk of amplified losses. Therefore, set leverage cautiously. Furthermore, in range markets, low volatility often leads to a higher number of trades. A higher trade count not only increases fees but also accumulates mental fatigue. Thus, avoid excessive trading and make calm decisions. Finally, continuously monitor market trends and respond promptly if the range market conditions change.
Range Market Summary
Range markets are market conditions where prices move within a certain range. By using appropriate analysis and strategies, it is possible to earn profits. This article provides a detailed explanation of the definition, characteristics, how to identify, trading strategies, and precautions for range markets. Range markets constantly change depending on market conditions, so it is important to trade based on the latest information. Additionally, compared to trend markets, range markets are relatively calm, but risks still exist. Therefore, thorough risk management and cautious trading are essential. Use this article as a reference to succeed in trading in range markets. Keep a close eye on market trends and be flexible in your responses.
Reference Sites
レンジ相場は、価格が一定の高値と安値の範囲内で変動する状態を指します。本記事では、レンジ相場の識別方法、トレンド相場との…
FX相場分析の鍵、レンジ相場を徹底解説!レンジ相場の意味から取引のコツまで、FX取引を成功に導く方法をご紹介します。初心…