What is a Currency Strength Heatmap?
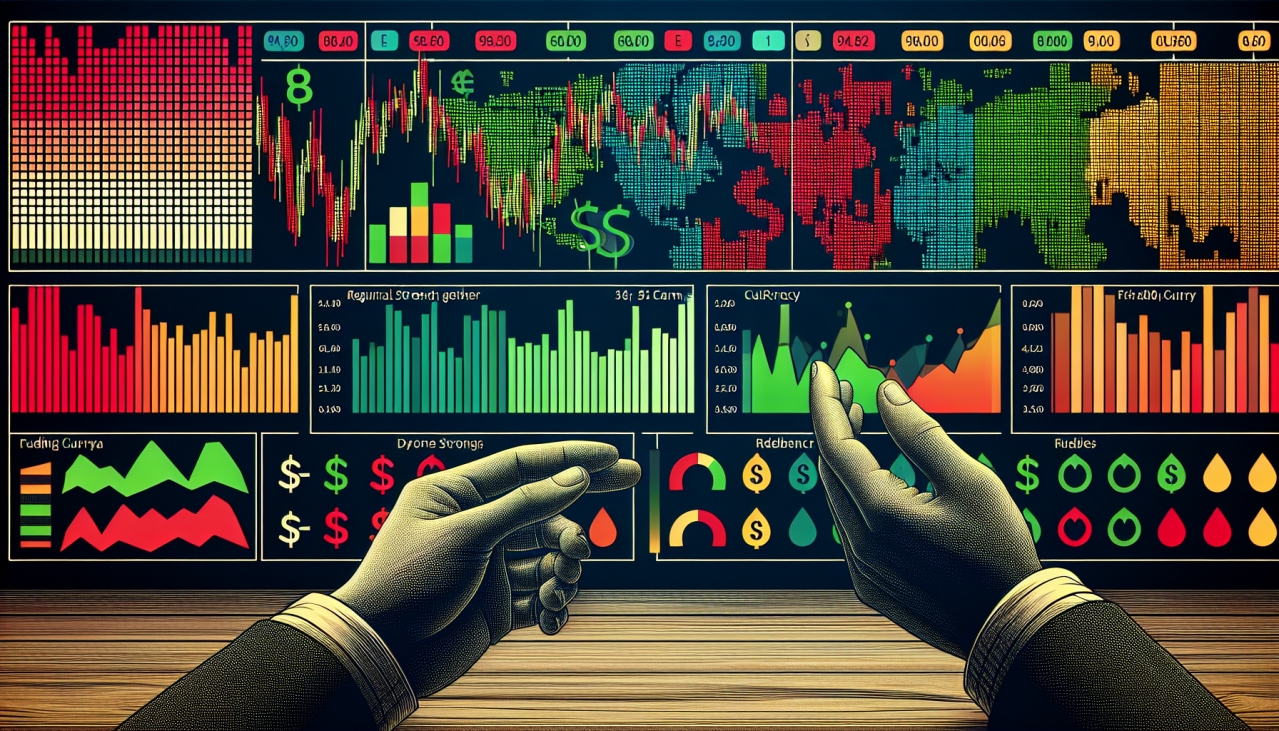
A currency strength heatmap is a visual tool that displays the relative strength and weakness of different currency pairs. By utilizing this heatmap, traders can quickly grasp market trends at a glance and make trading decisions swiftly and effectively.
The concept of currency strength indicates how strong or weak a specific currency is relative to others. This is a crucial indicator for understanding correlations between different currency pairs and identifying trends. For instance, if a currency is generally strong, you can avoid missing trading opportunities related to that currency.
The biggest advantage of such a heatmap lies in its ability to provide real-time data. As data is updated in real time, traders can formulate strategies based on the latest market information, leading to more precise trades. Real-time data is particularly important for short-term trading and scalping, offering a significant advantage in scenarios that demand quick responses.
By using a currency strength heatmap, you can leverage it as a powerful tool to understand the overall market picture and pinpoint optimal trading timings. Traders are encouraged to actively use this tool to make confident decisions in an ever-fluctuating market.

Real-Time Currency Heatmap
On this page, we’ve embedded TradingView’s currency heatmap. By using the heatmap below, users can instantly check currency strength and weakness in real time.
TradingView’s currency heatmap visually displays the relative strength and weakness of various currency pairs, supporting quick and effective trading decisions. This heatmap updates automatically, providing the latest market data in real time, making it an indispensable tool for traders.
Be sure to utilize the heatmap below to understand market movements and not miss out on optimal trading opportunities.
This heatmap offers a simple and intuitive interface, making it easy to use for all traders, from beginners to advanced. Real-time confirmation of currency strength and weakness enables quick trading decisions and can increase your success rate in the market.
Furthermore, utilizing this heatmap makes it easier to understand the correlation between currency pairs, allowing for more strategic trading. TradingView’s heatmap consistently provides the latest information, ensuring reliable and precise data for your trades.
Use the real-time currency heatmap to make your Forex trading even more powerful.
—Usage Guide
How to Use the Currency Heatmap
TradingView’s currency heatmap is a powerful tool that enables traders to quickly grasp market trends and make optimal trading decisions. This section provides a detailed explanation of how to use the currency heatmap, its interface, customization options, and data interpretation methods.
Basic Operations of the Currency Heatmap
- Checking the Display
- The currency heatmap visually displays the relative strength and weakness of different currency pairs. Green hues indicate that the currency is being bought, while red hues indicate it’s being sold.
- Specifically, dark green indicates a new daily high, while light green indicates a price higher than the opening price but not yet a new high for the day. Red indicates a new daily low, and light red indicates a price lower than the opening price but not yet a new low for the day.
- Selecting Currency Pairs
- Different currencies are displayed on the vertical and horizontal axes, and the strength/weakness of each currency pair is color-coded in each cell. For example, to check the Euro/US Dollar (EUR/USD) currency pair, select EUR from the vertical axis and USD from the horizontal axis, then check the color at their intersection.
How to Interpret Data
- Checking Strength and Weakness
- To quickly assess currency strength and weakness, evaluate the performance of each currency based on the heatmap’s colors. For instance, if the Euro is displayed in green against many currency pairs, it indicates that the Euro is generally strong.
- Identifying Trends
- Observe color patterns to identify market trends. If multiple currency pairs are displayed in the same color, it is highly likely that the currency is in a strong trend.
- Building Trading Strategies
- Construct trading strategies based on the heatmap data. For example, by adopting a strategy of buying strong currencies and selling weak ones, you can execute trend-following trades.
By utilizing the currency heatmap, you can quickly grasp the overall market picture and make effective trading decisions. Consistently making decisions based on the latest data can increase your success rate.
—Practical Applications in Forex Trading
Trading Strategies Using the Heatmap
The currency heatmap is an extremely useful tool for Forex traders. This section introduces how to use the currency heatmap to build specific trading strategies and scenarios.
Building Trading Strategies
- Strength-Based Trend Following Strategy By using the currency heatmap, you can identify strong trends. For example, if multiple currency pairs consistently appear in green on the heatmap, it indicates that the currency is in a strong upward trend. Based on this information, execute a trend-following strategy by buying strong currencies and selling relatively weak ones.
- Reversal Strategy The currency heatmap is also useful for finding extremely oversold or overbought currency pairs. For instance, if a currency consistently appears in red, it may be excessively oversold. You can utilize this information to attempt a reversal strategy.
Real Trading Examples
- Example 1: EUR/USD If the currency heatmap shows the Euro (EUR) in green against many pairs and the US Dollar (USD) in red, it can be determined that EUR/USD is in an uptrend. In this case, taking a long position on EUR/USD would be effective.
- Example 2: GBP/JPY If the Great British Pound (GBP) is strong and the Japanese Yen (JPY) is weak, a long position on GBP/JPY is recommended. Confirming this on the currency heatmap can make it easier to find entry points.
Key Points for Currency Pair Selection
- Choose Highly Liquid Currency Pairs Major currency pairs (e.g., EUR/USD, USD/JPY, GBP/USD) have high liquidity and narrow spreads, which can reduce trading costs. It’s important to monitor the movements of these currency pairs on the heatmap.
- Understand Correlations Understanding correlations between currency pairs allows for more effective risk management. For example, by trading currency pairs that tend to move in the same direction simultaneously, you can diversify risk.
By leveraging the heatmap, you can visually grasp market trends and achieve more strategic trades. Quick decision-making based on real-time data is key to success. Utilize the currency heatmap to further enhance your trading strategies.
—FAQ Section
Frequently Asked Questions
This section provides clear answers to frequently asked questions about currency strength heatmaps. It aims to resolve traders’ doubts and support them in utilizing the heatmap more effectively.
How often is the heatmap data updated?
Answer: Currency strength heatmap data is updated in real time. The system automatically updates data every few seconds to a few minutes to ensure you always have the latest market information. This allows traders to make timely decisions.
What do the colors on the heatmap mean?
Answer: On the heatmap, colors visually indicate the strength and weakness of a currency. Generally, green hues signify a strong currency, while red hues indicate a weak currency. Specifically, dark green indicates a new daily high, and light green indicates a price higher than the opening price but not yet a new high for the day. Conversely, dark red indicates a new daily low, and light red indicates a price lower than the opening price but not yet a new low for the day.
Which currency pairs are displayed on the heatmap?
Answer: The currency heatmap displays major currency pairs. This includes highly liquid pairs such as EUR/USD, USD/JPY, and GBP/USD.
Are there resources to learn how to use the currency heatmap?
Answer: Yes, our site provides guides and tutorials on how to effectively use the currency heatmap. Surprisingly, TradingView’s official website does not offer detailed manuals or help pages for their currency strength heatmap. Therefore, utilize the resources on our site to maximize the functionality of the heatmap. We offer content suitable for all levels of traders, from beginners to advanced.
What are the benefits of using a currency heatmap?
Answer: Using a currency heatmap allows traders to grasp market movements at a glance. This enables quick decision-making and can increase the success rate of trades. Additionally, real-time confirmation of currency strength and weakness allows for effective execution of various trading strategies, such as trend following and reversal strategies.
These FAQs aim to help users better understand and effectively utilize the currency heatmap. Please feel free to contact us if you have any questions.
—Related Links and Resources
Related Information and Resources
This section provides further information about currency heatmaps and links to related resources. This will allow users to gain a deeper understanding of how to utilize currency heatmaps and improve their trading skills.
TradingView’s Currency Heatmap
This is the official TradingView page where you can check the currency heatmap in real time. Access the latest currency strength data directly from this link.
A Must-See for Forex Traders! Latest Currency Chart Analysis