

The Relative Strength Index (RSI) is an important indicator in technical analysis. Traders and investors use the RSI to gauge market momentum and determine appropriate entry and exit points. This article will provide a detailed explanation of the RSI’s definition, features, interpretation, and practical trading strategies. By effectively using the RSI, you can expect to achieve more successful trades.
1. What is RSI? Definition and Features
RSI Overview
The Relative Strength Index (RSI) is a popular technical indicator used to analyze market sentiment and investor behavior. It primarily helps traders assess whether a market is overbought or oversold, aiding in their decision-making for buying and selling. The RSI value ranges from 0 to 100, providing an assessment of the strength and direction of a market trend.
How to Calculate RSI
The RSI is calculated based on the magnitude of recent price gains versus recent price losses over a specified period. The standard period is 14 days, and the formula is as follows:

A high RSI value suggests the market is bullish, while a low value indicates a bearish sentiment. Specifically, an RSI value above 70 is generally considered “overbought,” and a value below 30 is considered “oversold.”
Key Features of RSI
Oscillator Nature
As an oscillator, the RSI is highly responsive to market movements. This characteristic makes it very effective for understanding short-term market trends. It can also provide powerful signals, especially for contrarian strategies in a sideways or range-bound market.
Lagging Indicator Potential
On the other hand, the RSI is a lagging indicator, meaning it follows price changes. This can sometimes lead to false signals during periods of sharp price movements. Therefore, it is advisable for traders to use the RSI in conjunction with other technical indicators for confirmation.
Key Signal Thresholds
A common method of using the RSI is to analyze its values against key thresholds, such as 70 and 30. An RSI above 70 is often seen as overbought, while a value below 30 is considered oversold. These thresholds are based on empirical observation, and many traders refer to them to make trading decisions. When the RSI crosses these lines, it is often seen as a potential sign of a market reversal.
Points to Consider When Using RSI
The RSI is not a guarantee of high win rates, as it can be easily influenced by low market liquidity or external factors. When developing a trading strategy, it is crucial to consider not only the RSI signals but also the broader market conditions and relevant news. A comprehensive approach is essential for making sound judgments.


2. How to Interpret and Use the RSI
The Relative Strength Index (RSI) is an oscillator-based indicator used to gauge market momentum and determine overbought or oversold conditions. Here, we will explain in detail how to interpret and effectively use the RSI.
2.1 Interpreting RSI Values
The RSI fluctuates within a range of 0% to 100%. The values are typically interpreted as follows:
- Above 70%: An overbought condition. When the RSI surpasses this level, there is a high probability of a market reversal.
- Below 30%: An oversold condition. When the RSI drops below this level, it can signal an impending market rally.
This allows traders to identify potential entry points for a contrarian strategy.
2.2 Practical Applications of RSI in Trading
The RSI is primarily used in two types of strategies:
2.2.1 Contrarian Trading (Counter-Trend)
You can consider taking a short position when the RSI is above 70% or a long position when it is below 30%. Counter-trend trading is particularly effective in range-bound markets, but be cautious of false signals that can occur during strong trends.
2.2.2 Trend-Following Trading
By paying attention to the 50% centerline of the RSI, you can also take trend-following positions. When the RSI moves above 50%, it’s considered an uptrend, and you can enter a long position. Conversely, when it drops below 50%, it signals a downtrend, and you can take a short position. This method is effective when a trend is strong.
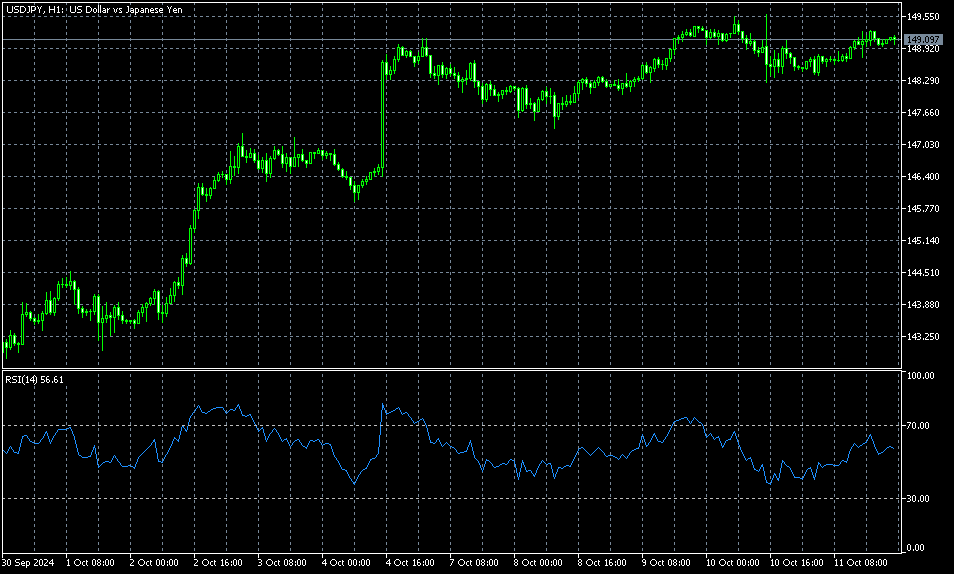
2.3 Visualizing the RSI
Most trading platforms allow you to display the RSI as a sub-window. This makes it easy to simultaneously track the RSI’s movement and price action in real-time. By observing the upward and downward movements of the RSI, you can better time your entries and exits.
2.4 Using RSI Divergence
Divergence using the RSI is a very powerful trading signal. When the price sets a new high or low, but the RSI fails to follow suit, it can be interpreted as a signal for a market reversal. In such situations, it’s crucial to observe carefully and make cautious decisions about your buy and sell timing.
2.5 Adjusting RSI Settings
While the standard RSI setting is 14 periods, you can modify this duration based on your trading style and market conditions. For example, for short-term trading, you can use a 7- or 9-period setting to make the indicator more responsive to price movements. On the other hand, if you focus on long-term trends, you might try a setting of 21 periods or more.
To use the RSI effectively, it is essential to have a solid understanding of what its values mean and how they relate to market conditions. Find a usage that fits your trading style and preferences.
3. Fundamental RSI Trading Strategies
Trading methods that utilize the Relative Strength Index (RSI) are primarily divided into two scenarios: range-bound and trending markets. Understanding and applying these strategies will enable more effective trading. Here, we will provide a detailed explanation of fundamental strategies and how to implement them.
3.1 Contrarian Strategy in a Range-Bound Market
In a range-bound market, prices move within a defined range, making contrarian trading particularly effective. This method uses the RSI to measure market momentum and find suitable entry points.
Sell Signal: When the RSI rises above 70%, the market is considered “overbought.” If the RSI then drops back below 70%, a price correction is likely to begin, presenting a selling opportunity.
Buy Signal: Conversely, when the RSI falls below 30%, the market is considered “oversold.” If the RSI then rises back above 30%, a price rebound can be expected, signaling a buying opportunity.
3.2 Trend-Following Strategy in a Trending Market
In a trending market, you can use the RSI to confirm the trend’s direction and apply a trend-following strategy. This approach provides effective trading opportunities by monitoring the RSI during an uptrend or a downtrend.
Uptrend Entry: First, identify the RSI’s horizontal resistance line. When the RSI breaks above this line, it can be seen as a signal that an uptrend is beginning, and you can enter a long position. To increase the certainty of the trend, it is recommended to use other technical indicators as well.
Downtrend Entry: Conversely, if the RSI breaks below its support line, it is a sign that a downtrend is beginning. In this case, you can consider entering a short position. It is important to monitor the trend’s continuation and take profits at the appropriate time.
3.3 Trading with Divergence
Divergence is a phenomenon where the RSI and price movements move in opposite directions, and it is a crucial signal that suggests a trend reversal. By using this signal, you can capture optimal entry points.
Bullish Divergence: A bullish divergence occurs when the price makes a new low, but the RSI forms a higher low. This is a sign that selling pressure is weakening, and a rebound may be imminent.
Bearish Divergence: Conversely, a bearish divergence occurs when the price makes a new high, but the RSI forms a lower high. This suggests the end of an uptrend, and you can prepare to enter a short position.
3.4 The Importance of Stop-Loss and Risk Management
When trading with the RSI, always set a stop-loss point and practice strict risk management. Especially in volatile markets, RSI signals are not always accurate, so cautious trading is required. By automatically closing your position at a predetermined stop-loss point when the price moves against your prediction, you can prevent significant losses. This will allow you to trade with more confidence.

4. Combining RSI with Other Indicators
While the RSI (Relative Strength Index) is a highly useful indicator on its own, combining it with other indicators can further enhance its effectiveness. In this section, we will explain how to combine the RSI with other indicators to improve your trading strategy.
4.1 Combining with MACD
The Moving Average Convergence Divergence (MACD) is an indicator used to measure the strength of a trend. Using the RSI and MACD together can improve the accuracy of your signals. For example, when the RSI crosses above 70% and the MACD turns downwards, it is a strong sell signal. Conversely, when the RSI drops below 30% and the MACD turns upwards, it is a buy signal. By confirming signals from both indicators, you can more easily pinpoint entry points.
4.2 Combining with Bollinger Bands
Bollinger Bands are an indicator that shows price volatility. By combining the RSI with Bollinger Bands, you can use the overbought/oversold signal of the RSI to confirm price movements. Specifically, if the RSI is below 30% and the price reaches the lower Bollinger Band, it can be interpreted as a buy signal. This combination can lead to more reliable entries.
4.3 Combining with Moving Averages
Moving Averages (MA) are fundamental indicators used to identify trends. Using the RSI and MA together allows you to confirm a trend and narrow down your entry timing. For instance, if the price is above the MA and the RSI crosses above 60%, you can consider entering a long position, as it suggests the uptrend will continue. On the other hand, if the price is below the MA and the RSI is below 40%, it signals a potential short position.
4.4 Combining with Stochastics
Stochastics is another oscillator indicator used to determine overbought and oversold conditions. Combining the RSI and Stochastics can generate even more powerful trading signals. For example, when both indicators simultaneously show an overbought signal, a reversal is highly likely, making it an excellent time to consider taking a position.
4.5 Practical Application to Deepen Your Knowledge
Experimenting with different combinations of the RSI and other indicators is crucial for gaining experience. Using backtesting to analyze historical data can help you discover which combinations work best for your trading style. It is also highly recommended to practice with a demo trading account to test various combinations without any financial risk.
While the RSI is effective on its own, it becomes an even more powerful tool when combined with other indicators. Find the right combination of indicators for you to broaden your trading strategy.
5. RSI Settings and Customization Tips
To effectively utilize the RSI (Relative Strength Index), it is essential to understand its parameter settings and how to adjust them. This section provides a practical guide and important points regarding RSI settings.
5.1 Initial Settings
The standard calculation period for the RSI is 14 periods. This setting was introduced by J.W. Wilder and is widely accepted. However, the optimal period can vary depending on your trading style and time frame, so it is important to adjust it to match your own preferences.
Suggested Examples:
- For short-term trading (scalping, day trading), a 9- or 5-period RSI is recommended.
- For long-term trading (swing trading, position trading), consider using a 22- or 42-period RSI.
5.2 Setting Key Thresholds
The typical RSI thresholds used are 70% and 30%, which indicate excessive buying or selling pressure. However, some traders who want a more sensitive response may set the RSI thresholds to 60% and 40%. This allows for more precise timing of entries and exits.
5.3 Visual Customization
To improve the visibility of the RSI, adjusting the line’s color and thickness can be very effective. It is particularly helpful to use different colors to distinguish between uptrends and downtrends. You can customize the color and style through the settings menu of your trading platform.
Specific Customization Example:
- Uptrend: Select a green line
- Downtrend: Select a red line
5.4 Implementing Alert Functions
When trading with the RSI, it is highly recommended to use alert functions. This allows you to react immediately when the RSI reaches a specific level. On platforms like MT4 and MT5, you can set up notifications when the RSI value reaches a specified threshold or a line is broken.
5.5 Regular Review
It is important to regularly review your RSI settings in accordance with market conditions. In strong trending markets, you might shorten the period to increase responsiveness. Conversely, in range-bound markets, using a slightly longer period can help reduce false signals.
Regular Testing
You should regularly check your trading results and continuously review whether your RSI settings are optimal. By consistently testing and adjusting, you can discover the best way to use the RSI for your personal trading style.

Summary
The RSI is a useful technical indicator for investors. However, to get more accurate trading signals, it’s best to use it in combination with other indicators rather than alone. It’s crucial to consider various factors, such as RSI settings, customization, and risk management, to adapt the indicator to your trading style. By regularly testing and adjusting your approach, you can establish an effective RSI-based strategy and aim for better trading results.
Frequently Asked Questions
What is RSI?
RSI (Relative Strength Index) is a prominent technical indicator that reflects the market’s psychological state. It ranges from 0 to 100, where a high value indicates an overbought market and a low value indicates an oversold market. Traders use this value as a reference to determine when to buy or sell.
How is RSI used?
RSI is mainly used in two strategies. One is a contrarian strategy, where a trader considers selling when the RSI exceeds 70% and buying when it drops below 30%. The other is a trend-following strategy, where a trader sees a break above the 50% line as a buying opportunity and a break below it as a selling opportunity. Traders often combine these methods, including the use of RSI divergence, to establish their own trading style.
What is the benefit of combining RSI with other indicators?
While RSI can be used on its own, combining it with other indicators like MACD, Bollinger Bands, or Moving Averages can increase the accuracy of your signals. When two or more indicators give a signal at the same time, it can be used as a more reliable entry point. It’s important to find the right combination that suits your trading style.
How should I adjust my RSI settings?
The standard RSI setting is 14 periods, but you should choose an appropriate period based on your trading style. A 9- or 5-period setting is suitable for short-term trading, while a 22- or 42-period setting is better for long-term trading. You can also customize the general thresholds of 70% and 30% to 60% and 40%, depending on your preference. Regularly reviewing and adjusting your settings to match market conditions is also important.