Technical analysis in Forex trading is a crucial tool for interpreting price movements. Among these, the “Yin-Yang Harami” (also known as the Bearish Harami or Harami Cross depending on the context of the second candle) is recognized as a valuable signal indicating a potential market reversal. This blog post will delve into the meaning and importance of the Yin-Yang Harami pattern. Understanding this pattern will enable you to identify more precise buy and sell timings.
1. What is the Yin-Yang Harami Pattern?
The Yin-Yang Harami (陰の陽はらみ), often referred to as a Harami pattern in English, is a candlestick pattern particularly observed when analyzing stock and foreign exchange price movements. This pattern frequently appears during a downtrend, and its formation can signal a potential market recovery, making it an important source of information for investors.
Pattern Characteristics
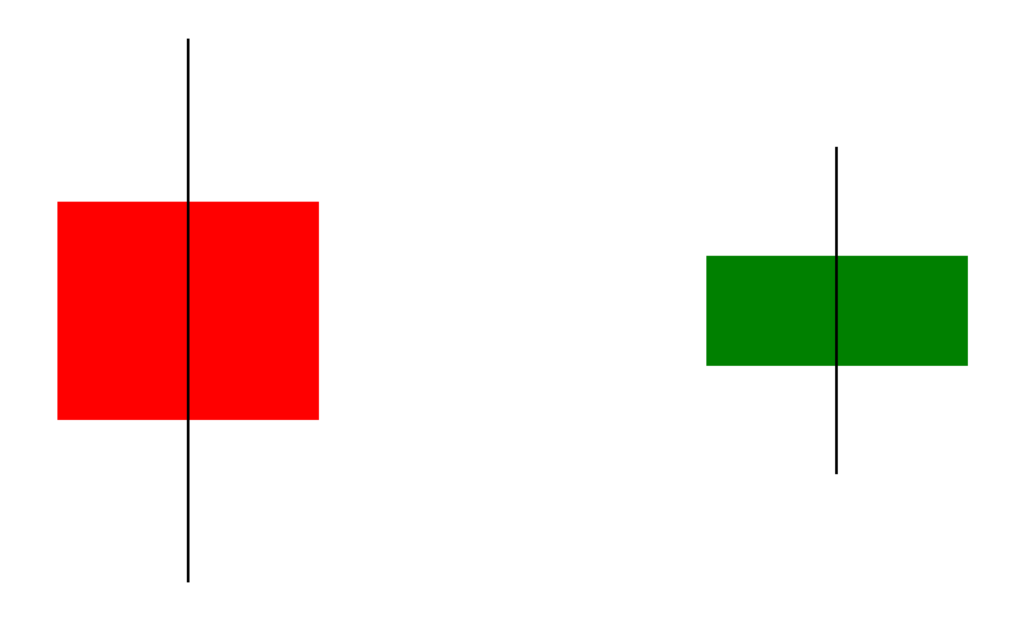
The Yin-Yang Harami consists of a combination of the following two candlesticks:
Formation of a Large Bearish Candle
The first candlestick to appear is a large bearish (red or black) candle, indicating a significant price drop for that day. At this stage, selling pressure dominates the market, and investor anxiety tends to be high.Appearance of a Bullish Candle
A bullish (green or white) candle forms on the next day, and it must be entirely contained within the real body of the previous day’s bearish candle. This bullish candle suggests that selling pressure is easing and buying interest is beginning to emerge.
The Yin-Yang Harami, depicted by such a combination, is considered an important signal that implies a potential market reversal.
Significance for Investors
When a Yin-Yang Harami appears, investors should pay close attention to subsequent price movements. In particular, the price action on the following day significantly influences the interpretation of the previous day’s pattern, so caution is required. By understanding this pattern, investors can better grasp market trends and make more informed decisions regarding buy and sell timings.
Properly understanding the Yin-Yang Harami can lead to better investment decisions amidst market uncertainties.


2. The Yin-Yang Harami Pattern Explained
The Yin-Yang Harami is a crucial chart pattern formed by specific candlesticks that helps interpret market trends. In this section, we will delve into the specific pattern of the Yin-Yang Harami and its characteristics.
Basic Structure of the Yin-Yang Harami
The Yin-Yang Harami is composed of the following two candlesticks:
Large Bearish Candle (Day 1): First, a large bearish candle appears on the preceding day. This candlestick indicates that the market is under strong selling pressure. Typically, the price moves significantly lower from the previous day’s closing price.
Bullish Candle (Day 2): On the next day, a bullish candle appears, which is contained within the real body of the large bearish candle. This bullish candle reflects that the market was oversold, and buying momentum is returning.
Shape of the Yin-Yang Harami
A key characteristic of this pattern is that the second day’s bullish candle is drawn entirely within the real body of the first day’s large bearish candle. This condition is often referred to as “Harami” by many traders and is seen as a sign of an impending upward reversal.
For example, imagine the following candlestick movements:
- Day 1: A large bearish candle, with the price significantly dropping from the previous day’s high.
- Day 2: A bullish candle appears, remaining within the real body of the first day’s bearish candle. In this case, the high starts higher than the previous day, but the closing price is lower than the previous day’s low.
Conditions for Yin-Yang Harami Appearance
For this pattern to function correctly, the following conditions must be met:
Must be in a Downtrend: It’s crucial for the Yin-Yang Harami to appear within a downtrend. This confirms the market’s potential for a rebound.
Appearance of a Large Bearish Candle: The large bearish candle formed on the preceding day is an important selling signal for traders. This large bearish candle indicates that the market is in an oversold state.
Formation of a Bullish Candle: The bullish candle appearing the day after the large bearish candle is a sign that buying power is returning. For it to qualify as a Harami, this bullish candle must be contained within the real body of the bearish candle.
The Yin-Yang Harami is a valuable indicator for making investment decisions based on market price action. Grasping the key points of its shape and confirming it on actual charts will contribute to your growth as a trader.

3. Signals Indicated by the Yin-Yang Harami
The Yin-Yang Harami is known as a highly significant signal, especially in stock chart analysis. When this pattern appears, it helps in interpreting various market movements. Here, we’ll take a closer look at the signals indicated by the Yin-Yang Harami.
Signal Definition
The Yin-Yang Harami forms under the following conditions:
- On Day 1, a large bearish candle appears.
- On Day 2, a bullish candle emerges, contained within the real body of Day 1’s candle.
When this pattern is established, it suggests a high probability of a turning point in market movement.
Bullish Signal
Specifically, if the Yin-Yang Harami appears in a low price range, and the market closes with an upward-biased bullish candle on the following day, it can be interpreted as a turning point towards an uptrend. This suggests that buying pressure is gradually increasing, implying a higher probability of a buying entry point for traders.
- Example:
- Yin-Yang Harami appears in a low price range.
- If the next day opens higher and closes with a bullish candle ⇒ An uptrend reversal can be expected.
Bearish Signal
Conversely, if a Yin-Yang Harami forms and then Day 3 closes with a downward-biased bearish candle, there’s a possibility of the downtrend continuing. In this case, it indicates that market bullishness has been eroded, and traders should exercise caution.
- Example:
- Yin-Yang Harami appears.
- If the next day opens lower and closes with a bearish candle ⇒ Continuation of the downtrend is suggested.
Importance of Comprehensive Judgment
However, the appearance of the Yin-Yang Harami alone is not enough to fully grasp market movements. It’s crucial to consider the overall market trend and other technical indicators. Trading based solely on the Yin-Yang Harami carries risks, so it’s essential to make decisions in conjunction with other confirmation methods.
The Yin-Yang Harami is a powerful signal for identifying market turning points. Understanding its significance and using it as part of a sound trading strategy can lead to better investment outcomes.

4. Importance of the Yin-Yang Harami
What is the Role of the Yin-Yang Harami?
The Yin-Yang Harami is widely recognized as a crucial signal for identifying market reversal points. When this pattern appears, investors need to pay attention to potential shifts in market dynamics. Especially when it forms in the lower price range of a downtrend, the price movement on the following day holds significant meaning, making it an unmissable point.
Indicating Changes in Market Environment
A key point indicated by this pattern is the potential change in market participant psychology. Typically, after a series of large bearish candles, the appearance of a small bullish candle raises the question, “Will this downtrend continue?” When the bullish candle remains within the range of the previous day’s large bearish candle, it suggests a situation where the market may be preparing for a reversal.
Especially Noteworthy is the Third Day
The importance of the Yin-Yang Harami particularly lies in the price movement on the third day. If a bullish candle appears on the third day and closes higher, it strongly suggests a shift to an uptrend, which investors can interpret as a buy signal. Conversely, if a downward-biased bearish candle appears, it indicates the continuation of a downtrend, requiring caution. Thus, the movement on the third day becomes a factor that influences future market direction.
Statistical Reliability
While the formation of a Yin-Yang Harami is limited, its statistical reliability when it does occur is also important. Based on historical data, information can be obtained regarding the probability of an upward movement on the following day and price movements a week later when this pattern appears. This provides investors with material to predict market trends more accurately.
Identifying Trend Reversals
Furthermore, the effectiveness of the Yin-Yang Harami can be enhanced by combining it with other technical analysis tools. For example, by using it in conjunction with moving averages, RSI, Bollinger Bands, and other indicators, you can evaluate market conditions from multiple angles and formulate a more reliable trading strategy. In this way, the Yin-Yang Harami demonstrates its true value not only when used alone but also when combined with other analytical methods.
5. Real-World Examples of the Yin-Yang Harami
Observing the Yin-Yang Harami pattern on actual charts allows you to understand its effectiveness and the strength of its signals. Here are some specific examples:
Example 1: Sundrug Chart
At the end of December 2022, a Yin-Yang Harami appeared on the Sundrug chart. Here, following a large bearish candle on the previous day, a bullish candle formed, creating the Harami pattern. In this case, the Yin-Yang Harami occurred at a high price range, and subsequent price movements showed a decline, prompting an awareness of a market reversal.
Example 2: Kawasaki Heavy Industries Chart
On the other hand, the Kawasaki Heavy Industries chart showed a case where a decline continued even after a Yin-Yang Harami appeared. At that time, when the Yin-Yang Harami emerged, the market seemed to be in a low price range, but it actually experienced further decline. This illustrates that the appearance of a Yin-Yang Harami does not necessarily indicate the start of an uptrend.
Example 3: Analysis from Historical Data
Reviewing historical data allows you to grasp the tendencies of how the Yin-Yang Harami signal functions. For instance, in specific stock price data, when a Yin-Yang Harami appeared, there were cases where an uptrend reversal occurred if the next day’s price movement closed with a bullish candle. Conversely, if it closed with a bearish candle, the downtrend often continued, enabling traders to formulate their next buy/sell strategy.
Example 4: Observing Real-time Charts
In actual trading, careful observation is required. When a Yin-Yang Harami appears, it’s crucial for traders to closely monitor the movement on the following day. By observing the price progression after its appearance on the chart, you can personally experience how the Yin-Yang Harami pattern works.
By tracking the movements of the Yin-Yang Harami in real-time, investors may be able to capture market reversal signs and take more effective trading actions. Through such specific examples, it’s possible to deepen your understanding of the importance of the Yin-Yang Harami.

Summary
The Yin-Yang Harami is a highly important pattern in stock and foreign exchange markets, serving as a powerful signal indicating market reversals. By properly understanding this pattern and combining it with other technical analyses, investors can more accurately interpret market trends. Confirming specific chart examples and deepening your understanding of the Yin-Yang Harami’s significance and application will lead to wiser investment decisions. Always paying attention to market changes and cultivating adaptability will be key to long-term investment success.
Frequently Asked Questions
What kind of pattern is the Yin-Yang Harami?
The Yin-Yang Harami pattern begins with a large bearish candle appearing on the first day, followed by a bullish candle forming on the next day. The second day’s bullish candle must be contained within the real body of the first day’s large bearish candle. This pattern is considered a sign of a potential market reversal.
What signals does the Yin-Yang Harami indicate?
After a Yin-Yang Harami forms, the movement on the third day is crucial. If a bullish candle appears with an upward bias on the third day, an uptrend reversal can be expected. Conversely, if a downward-biased bearish candle continues, it suggests the possibility of further decline.
How should the Yin-Yang Harami be utilized?
The Yin-Yang Harami alone is often not sufficient; it’s important to combine it with other technical indicators for comprehensive judgment. Also, understanding the pattern’s characteristics and preceding/succeeding price movements by observing actual charts will lead to effective utilization.
Can you provide specific examples of the Yin-Yang Harami?
Reviewing past chart data reveals tendencies in the price movement on the day after a Yin-Yang Harami appears. For instance, there are cases where prices rose after a Yin-Yang Harami in a low price range, and cases where prices fell after one in a high price range. Through these specific examples, you can understand the significance of the pattern.
References
包み足(アウトサイドバー)とはらみ足(インサイドバー)は、2本のローソク足を組み合わせた形状のことです。本記事では、包み…

相場の転換点を見逃さないために、チャートの味方を理解していくことはとても重要です。色々な見方がある中で、包み足やはらみ足…