
The Island Reversal is one of the most crucial indicators among chart patterns. This blog post provides a detailed explanation of the Island Reversal, covering its formation process, signals, and how to identify optimal timing for buying and selling. We’ll introduce various valuable insights to help you navigate trading, including how to accurately interpret market movements and seize opportunities. Are you ready to delve into the profound world of the Island Reversal?
- 1 1. What is an Island Reversal?
- 2 2. Island Reversal Formation Process
- 3 3. Island Reversal Signals
- 4 4. Trading During an Island Reversal
- 5 5. How to Identify False Island Reversal Signals (Traps)
- 6 Summary
- 7 Frequently Asked Questions
- 7.1 What is the distinctive shape of an Island Reversal?
- 7.2 How does the Island Reversal formation process proceed?
- 7.3 Island Reversals have two patterns: “Island Top” and “Island Bottom.” What are their respective characteristics?
- 7.4 What are the key points for identifying false Island Reversal signals (traps)?
1. What is an Island Reversal?
An Island Reversal is a technical indicator that displays a unique pattern on financial market charts. This pattern generally signals a trend reversal, often indicating a shift from an uptrend to a downtrend or a recovery from a downtrend to an uptrend.
Distinctive Shape
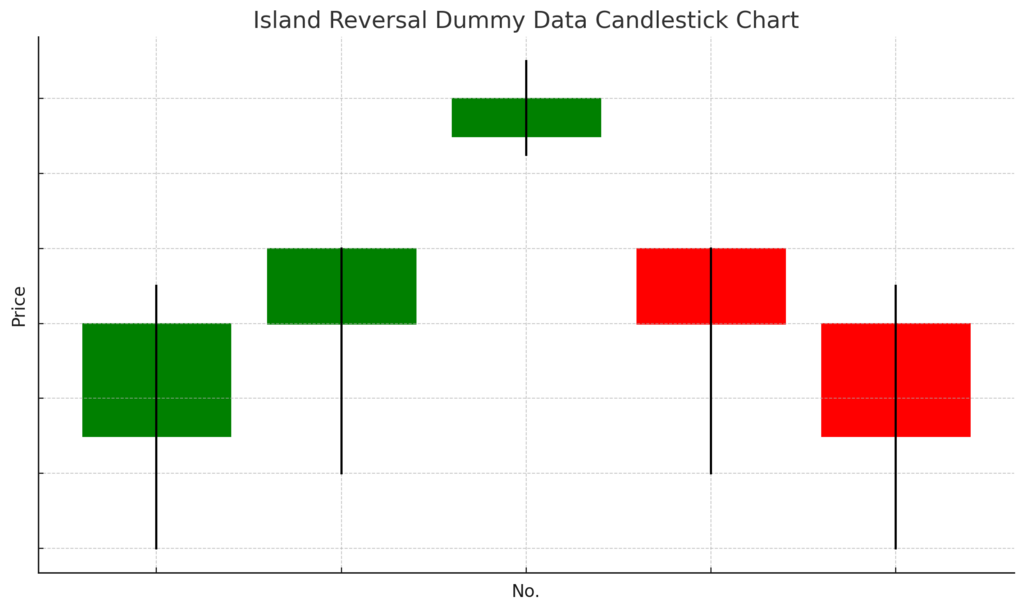
An Island Reversal is formed by two accompanying gaps. The first gap opens during an ongoing trend, causing the market price to rapidly increase or decrease. Subsequently, the price reverses, and by opening another gap in the opposite direction, it returns to the original price range, creating an “isolated island” shape on the chart. This structure is a key characteristic of the Island Reversal.
Importance of Gaps
In this pattern, the price range located between the first and second gaps commonly acts as a very strong resistance or support zone. In particular, the psychological impact these gaps have on market participants is significant, strongly influencing investors’ buying and selling decisions.
Formation Process
The formation of an Island Reversal typically proceeds as follows:
- In an uptrend, the market makes a sharp ascent by opening an upward gap, followed by a short-term reversal.
- After this, it opens a downward gap, showing a movement where the price returns to its original level.
Thus, an Island Reversal can be formed by a single candlestick or several candlesticks, making its isolated chart appearance appealing.
Impact of Investor Psychology
Behind the formation of an Island Reversal are psychological factors of investors towards the market. Specifically, investors who entered expecting profit from the initial rise are more likely to incur unrealized losses during the subsequent reversal. This is because many investors holding losses increase selling pressure, which further promotes price declines.
Meaning of the Term
Directly translated to “reversed island” in Japanese, the Island Reversal, as its name suggests, is perceived as an important signal indicating a market trend reversal. Understanding this pattern helps investors to identify price reversals earlier and develop effective trading strategies.

2. Island Reversal Formation Process
The Island Reversal is a chart pattern that forms under specific conditions. Understanding this pattern is crucial for identifying market reversals. Below is a detailed explanation of its formation process.
2.1 First Stage of Formation: Upward Gap in an Uptrend
An Island Reversal begins with an upward gap opening in an uptrend. During this stage, stock prices rise sharply, and investor expectations grow as the ascent continues. A characteristic feature at this time is a rapid price surge, especially near the highest point, attracting more investors.
2.2 Second Stage of Formation: Appearance of Eager Investors
Next, an isolated island near the highest point forms while prices are rising. In this state, newly entered investors buy and sell, attempting to ride the uptrend, causing prices to temporarily surge. Investors at this point decide to buy at high prices, which will significantly impact the future market.
2.3 Third Stage of Formation: Downward Gap Signaling Decline
Subsequently, prices fall sharply, and a downward gap appears. At this moment, investors who bought near the peak rush to sell, accelerating the downward movement. This marks a turning point in the market, signaling a transition from an uptrend to a downtrend.
2.3.1 Psychological Factors
At this stage, investors holding unrealized losses begin to feel psychological pressure, leading even more people to sell. This accelerates the decline and contributes to the establishment of the Island Reversal.
2.4 Final Stage of Formation: Market Reversal
Finally, with the formation of the Island Reversal, the market fully transitions from an uptrend to a downtrend. At this stage, new movements have already been observed for several days, and the entire market is ready to enter a strong downtrend.
Due to its shape, the Island Reversal forms a very strong resistance zone and effectively functions as a reversal signal. Investors are required to understand this to predict future trends and formulate appropriate strategies.

3. Island Reversal Signals
The Island Reversal provides very clear reversal signals on trading charts, making it crucial to understand them thoroughly. Specifically, there are two main forms of this signal: “Island Top” and “Island Bottom.”
Island Top and Island Bottom
Island Top: This pattern forms when an upward gap first opens during an uptrend, immediately followed by a downward gap. When an Island Top appears, it is considered a sell signal, as the uptrend may be reversing.
Island Bottom: Conversely, an Island Bottom forms when a downward gap first opens during a downtrend, followed by an upward gap. This signal indicates a reversal from a downtrend and is evaluated as a buy entry signal.
Reliability Factors
Island Reversal signals are considered highly reliable because they significantly impact market movements, but several factors influence their reliability.
Time to Form: If an Island Reversal forms rapidly, the reversal momentum is considered strong. On the other hand, if it takes a long time to form, its reversal reliability may diminish.
Number of Candlesticks: An island can sometimes be formed by a single candlestick, but if it consists of multiple candlesticks, the reliability of the signal increases. Especially when formed after a period of consolidation, the movement in the opposite direction is more likely to be stronger.
How to Utilize Buy/Sell Signals
The buy and sell signals using the Island Reversal are clear, and it is important to pay attention to the following points:
Island Top: Recommended timing for a sell entry. After the first gap opens, a further upward gap suggests a reversal at the top.
Island Bottom: Recommended situation for a buy entry. A newly opened gap allows for capturing the exact moment of a market bottom.
By deepening your understanding of these signals, you can more accurately grasp market judgments and entry opportunities, thereby helping to improve your trading success rate.
4. Trading During an Island Reversal
Identifying Entry Timing
When trading with an Island Reversal, identifying the entry timing is crucial. Generally, entries for Island Reversals follow these rules:
- For an Island Bottom: When the first gap opens after a market decline, prepare for a buy entry.
- For an Island Top: After the first gap opens following an ascent, prepare for a sell entry.
Confirming Buy/Sell Signals
When an Island Reversal forms, the key point to watch is the movement of the two gaps. Observe how the market moved after the first gap was confirmed. Refer to the points below:
Observing Consolidation: If a period of consolidation is observed after the first gap opens, the market reversal tends to be stronger. At this point, consider adjusting your position.
Timing of the Second Gap Opening: When the second gap opens, the market trend reversal fully takes hold. It is ideal to make new entries here and try to close existing unrealized loss positions.
Position Management and Risk Management
Position management when utilizing an Island Reversal is extremely important for minimizing risk. Keep the following points in mind:
- Setting Risk Tolerance: Clearly define your risk tolerance and understand how much loss you can tolerate if an Island Reversal completes.
- Progressive Position Adjustment: When the second gap opens, you don’t necessarily need to close all open positions, but adjustments are required to minimize risk.
Developing an Exit Strategy
Just like entry, establishing an exit strategy is also vital. Specific signals include the following:
For an Island Bottom in an Uptrend: After a buy entry, consider taking profits when the market begins to rise again. Profit-taking at the moment the second gap opens is particularly desirable.
For an Island Top in a Downtrend: After a sell entry, if the market starts to reverse, closing positions early can minimize losses.
Thus, trading using an Island Reversal requires a consistent approach to entry timing, position management, and exit strategy. By understanding each element and applying it in practice, you can achieve more effective trades.

5. How to Identify False Island Reversal Signals (Traps)
The Island Reversal is a highly valued technical pattern for many traders, but blindly trusting it carries risks. Specifically, there’s a possibility of false signals (traps), making it crucial to identify them. Here are key points to discern false signals:
1. Size of the Second Gap
The size of the second gap, a characteristic element of the Island Reversal, is an important indicator of the signal’s reliability. The larger this gap, the stronger the market’s energy to fill it, and the higher the probability of a reversal. Conversely, if the gap is small, it can often be easily filled, increasing the likelihood of the trend continuing.
2. Occurrence of Large Bullish or Bearish Candlesticks
If strong bullish (陽線) or bearish (陰線) candlesticks appear after an Island Reversal forms, the credibility of the signal increases. Such clear directional movements indicate that trader psychology is strongly influenced in the opposite direction, reducing the risk of a false signal.
3. Confirmation by Multiple Candlesticks
When an Island Reversal is formed by several candlesticks rather than a single one, the signal is considered more robust. Continuous formation reflects the intentions of many traders, increasing the pressure during a reversal. However, it’s also necessary to consider the impact of sudden news or events.
4. Importance of Time Elapsed
The time it takes for an Island Reversal to form also affects the reliability of the signal. Rapid formation is considered a strong signal, but if it takes a long time to form, its reliability may decrease. Therefore, it’s important to analyze from a temporal perspective as well.
5. Monitoring Trading Volume
Trading volume at the time of an Island Reversal is also a critical indicator for identifying false signals. When trading volume is high, the movement is often reliable, but conversely, low trading volume increases the risk of a false signal. It’s essential to be sensitive to trading volume trends and ensure thorough risk management.
By evaluating the Island Reversal with these factors in mind, you can avoid false signals and make more meaningful trades. Establish your judgment criteria firmly and review your approach to the market.
Summary
The Island Reversal is an important technical indicator of market reversals, but careful analysis is required to enhance its reliability. It’s crucial to comprehensively consider factors like candlestick shape, changes in trading volume, and time elapsed to identify the possibility of false signals. Additionally, by properly setting entry, position management, and exit strategies, you can effectively utilize the Island Reversal. Traders who deepen their knowledge and incorporate this into their trading methods should achieve more stable returns.
Frequently Asked Questions
What is the distinctive shape of an Island Reversal?
An Island Reversal is formed by two accompanying gaps. The first gap opens during an ongoing trend, causing the market price to rapidly increase or decrease. Subsequently, the price reverses, and by opening another gap in the opposite direction, it returns to the original price range, creating an “isolated island” shape on the chart.
How does the Island Reversal formation process proceed?
First, an upward gap opens in an uptrend, followed by the formation of an isolated island near the highest point. Then, prices fall sharply, and a downward gap opens. At this stage, investors holding unrealized losses begin to feel psychological pressure and choose to sell, accelerating the market reversal. Finally, the Island Reversal completes, indicating a transition from an uptrend to a downtrend.
Island Reversals have two patterns: “Island Top” and “Island Bottom.” What are their respective characteristics?
An Island Top forms when an upward gap first opens during an uptrend, immediately followed by a downward gap. This is considered a sell signal. Conversely, an Island Bottom forms when a downward gap first opens during a downtrend, followed by an upward gap. This signal is evaluated as a buy entry signal.
What are the key points for identifying false Island Reversal signals (traps)?
Key points for identifying false Island Reversal signals include the size of the second gap, the occurrence of large bullish or bearish candlesticks, confirmation by multiple candlesticks, the time it takes to form, and trading volume trends. By comprehensively judging these factors, you can identify highly reliable signals.