
- 1 1. What is the ADX Indicator? A Tool for Gauging Trend Strength
- 2 2. What is ADX? Role and Key Characteristics
- 3 3. ADX and DMI: The Key to Understanding Trend Direction
- 4 4. How to Use ADX: Gauging Trend Strength
- 5 5. Using ADX for Entry and Exit Points
- 6 6. Combining ADX with Other Indicators: Effective Trend Analysis
- 7 7. Summary and Key Takeaways: How to Effectively Use the ADX Indicator
- 8 References
1. What is the ADX Indicator? A Tool for Gauging Trend Strength
When trading, it’s not just the direction of price movements (up or down) that matters—the “strength” of a trend is also a crucial factor. In liquid markets like forex and stocks, accurately assessing trend strength helps you effectively determine entry and exit points. This is where the **ADX (Average Directional Index) indicator** comes in handy.
Developed by technical analysis pioneer J. Welles Wilder in 1978, ADX is still widely used by traders today. This indicator is generally used to show the “strength of a trend” and does not directly indicate the direction of the price. In other words, the ADX’s key feature is its ability to measure if a trend is strong, regardless of whether the price is moving up or down.
For many traders, the ADX is a core indicator that underpins trend-following strategies. When the ADX indicates a strong trend, the reliability of entries in that direction increases. Conversely, if the ADX suggests a weak trend, you may need to consider that the market is transitioning to a sideways or ranging market. In this article, we’ll dive into the basic mechanics and uses of the ADX to provide you with practical knowledge for your trading.

2. What is ADX? Role and Key Characteristics
The **ADX (Average Directional Index)** is a technical indicator that measures the “strength of a trend,” not the price’s “direction.” When used with **+DI (Positive Directional Index)** and **-DI (Negative Directional Index)**, the ADX helps you visually grasp market movements by comparing the strength of uptrends and downtrends.
ADX Structure and Value Interpretation
The ADX typically ranges from 0 to 100. A higher value indicates a stronger trend. The values are generally interpreted as follows:
- 0-20: The trend is weak, and the market is likely in a consolidation or ranging state.
- 20-25: An indication that a trend is beginning to form. This is a level to watch closely.
- Above 25: A trend has developed, and trend-following entries can be considered.
For example, if the ADX is above 25, it suggests that the current trend has momentum and the price is moving in a single direction. Conversely, if the ADX is below 20, the market is more likely in a range, and you should be cautious about when to enter a trade.
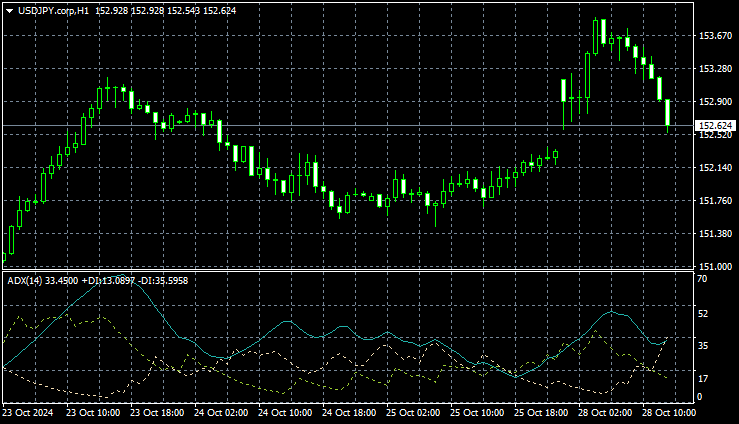
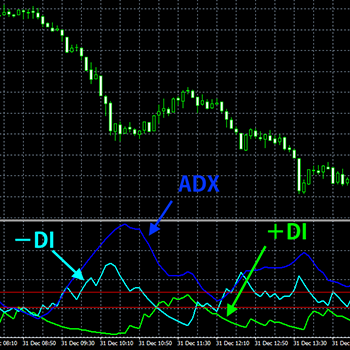
Image: MT4 ADX Indicator
The Relationship Between ADX and DMI
The ADX is typically used with the **DMI (Directional Movement Index)**. The DMI consists of two lines, +DI and -DI, and their relative positions help determine the trend’s direction.
- When +DI is above -DI: Suggests an uptrend.
- When -DI is above +DI: Indicates a potential downtrend.
By looking for a cross between the +DI and -DI lines and an ADX value above 25, you can confirm that a strong trend is in place. While a cross can signal an entry point, the price doesn’t always move in that direction, so it’s essential to use other indicators and manage your risk.
How ADX is Calculated (Simplified)
The calculation of ADX is a bit complex. First, the DMI is calculated, and then the ADX is derived by taking the average of the DMI over a specific period. A 14-period moving average is commonly used to determine if a trend is developing. While you don’t need to deeply understand the detailed calculation, it’s good to remember that the ADX measures “trend strength” and that trend “direction” is determined by the DMI.
3. ADX and DMI: The Key to Understanding Trend Direction
While the ADX alone shows the “strength” of a trend, combining it with the **DMI (Directional Movement Index)** is essential to clearly identify the price’s “direction.” The DMI consists of two lines—the “Positive Directional Index” (+DI) for uptrends and the “Negative Directional Index” (-DI) for downtrends—and their relationship helps you predict the trend’s direction.
How DMI Works: The Roles of +DI and -DI
The +DI (Positive Directional Index) measures the strength of upward movement based on the difference between the current and previous candlestick highs. The -DI (Negative Directional Index) measures the strength of downward movement based on the difference in lows. By observing the relationship between these two lines, you can determine if the trend is upward or downward.
- When +DI is above -DI: This indicates that the price is in an uptrend and is often seen as a signal to buy.
- When -DI is above +DI: This suggests that the price is in a downtrend and is viewed as a signal to sell.
Combining DMI and ADX: How to Spot a Strong Trend
While a DMI cross (+DI and -DI intersecting) suggests a trend direction, the ADX complements this by confirming the trend’s strength. For example, if the +DI crosses above the -DI and the ADX value is above 25, it’s highly likely that a strong uptrend is forming, which increases the validity of your entry. Conversely, if the ADX is below 20, the trend is weak even if a +DI cross occurs, and it’s likely a ranging market, so you should be cautious.
Signals from ADX and DMI Crosses
A cross between the +DI and -DI lines is also a key signal for a potential market reversal. The following cases are important points to consider for your trading decisions:
- Buy Signal: When the +DI crosses above the -DI. A rising ADX at this time suggests the uptrend is strengthening.
- Sell Signal: When the -DI crosses above the +DI. If the ADX is rising, it indicates that the downtrend is likely to continue, and this can be used as a potential sell entry point.
However, if a cross occurs but the ADX is flat or declining, the trend is weak, and it could be a ranging market or a false signal. Therefore, it’s crucial to watch the ADX’s movement in addition to the +DI and -DI cross to more accurately assess both the trend’s strength and its direction.

4. How to Use ADX: Gauging Trend Strength
The greatest benefit of using the ADX is its ability to visually confirm the “strength” of a trend. When a trend is strong, entries in the direction of the trend are more effective. Conversely, when the trend is weak or the market is ranging, it is generally best to avoid entering a trade. By paying close attention to whether the ADX value is increasing or decreasing, you can effectively assess the trend’s momentum.
Interpreting ADX Values: Trend Formation and Disappearance
ADX values are generally interpreted based on the following criteria:
- 0-20: Little to no trend; the market is likely in a ranging state.
- 20-25: Signs of a trend forming, but it is not yet a clear, defined trend.
- Above 25: A strong trend is in place, and a trading entry can be considered.
- Above 50: An extremely strong trend is in place, but you should also consider the possibility that the trend is nearing its end.
For instance, if the ADX is above 25, the current trend is considered to have a certain amount of strength. If you are considering a buy entry, a high ADX value indicates a strong uptrend, while a high ADX value with a sell entry suggests the downtrend is strong.
Trend Strength and ADX Changes
The rate of change in the ADX is also a key indicator of trend strength. Specifically, when the ADX is rising, it indicates that the trend is accelerating, which can be a favorable entry point for traders. Conversely, if the ADX is declining, the trend is considered to be weakening, and you should be cautious about entering a trade.
For example, if the ADX is rapidly rising during an uptrend, the trend is likely strengthening, and it may be a good time to enter. On the other hand, if the ADX starts to decline, it suggests the trend may be losing momentum, making it a good time to consider exiting your position.
Entry Strategy Using ADX
You can follow these steps to implement an entry strategy using the ADX:
- Check ADX and DMI: First, confirm the relationship between the +DI and -DI to determine the trend’s direction.
- Confirm the ADX value: If the ADX value is above 25, a strong trend is likely in place, and you can consider an entry.
- Assess trend strength: If the ADX is rising, the trend is gaining strength, which increases the reliability of your entry.
- Watch for ADX decline: If the ADX starts to decline, it may indicate the trend is ending, so consider exiting your position or implementing an exit strategy.
By observing the ADX’s movement, you can gauge the strength of a trend, capture trading opportunities, and manage your risk effectively.

5. Using ADX for Entry and Exit Points
The ADX indicator is helpful for understanding trend strength, but it also provides crucial signals for determining entry and exit timings. Here, we’ll explain specific methods for entering and exiting trades using the ADX and DMI.
Finding Entry Points
By combining the ADX and DMI, you can identify buy and sell entry points. The following strategies are based on a cross between the +DI and -DI, as well as changes in the ADX.
- Buy Entry Signal
- A cross where the +DI moves above the -DI from below suggests the start of an uptrend.
- If the ADX is also above 25 and rising, it indicates that the trend is gaining strength, making it a strong signal for a buy entry. This allows you to enter a trade in the direction of a strong trend.
- Sell Entry Signal
- When the -DI moves above the +DI from below, it indicates a potential downtrend is starting.
- If the ADX is also above 25 and rising, it confirms that the downtrend is strengthening, making a sell entry more valid.
Judging Exit Timings
Just as with entries, the ADX is useful for determining when to exit a trade. Consider the following points when making an exit decision:
- When the ADX flattens or turns downward
- When the ADX reaches a peak and starts to flatten or decline, the trend may be losing momentum. This suggests a decrease in trend strength and is often used as a signal to take profits.
- Check for Divergence
- Divergence is a situation where the price is moving up, but the ADX or DMI values are decreasing. This is a sign of a potential trend reversal, indicating that the current trend may be coming to an end. In such cases, it is often recommended to consider closing your position.
Summary of Entry and Exit
When entering or exiting a trade, you should consider the ADX value and its movement, as well as the crosses of the +DI and -DI. Additionally, it is always a good idea to use the ADX in conjunction with other indicators (like moving averages) for more accurate trading. By leveraging the strengths of trend-following strategies, you can effectively time your entries and exits.

6. Combining ADX with Other Indicators: Effective Trend Analysis
While the ADX is an excellent tool for gauging trend strength, combining it with other indicators can further enhance your trading strategy. Since the ADX doesn’t directly show trend direction, using indicators that complement its function can significantly increase the reliability of your trading decisions.
Combining Bollinger Bands and ADX
Bollinger Bands are an indicator that shows price volatility. The upper and lower bands expand and contract in response to price movements. When the bands narrow and then suddenly expand, it suggests that a new trend is likely to form. If the ADX is above 25 and rising at this time, you can infer that a trend is gaining strength, making it a good time to consider an entry.
Combining Moving Averages and ADX
Moving averages are widely used to confirm the direction of a price. Generally, when a short-term moving average crosses above a long-term one, it suggests an uptrend, and the reverse indicates a downtrend. When this moving average cross occurs and the ADX is also above 25, it provides a stronger basis for your entry, as a strong and clear trend is in place.
For example, if a bullish moving average cross forms and the ADX is above 25, you can confirm a strong uptrend and consider a buy entry. Conversely, if a bearish moving average cross forms with the ADX above 25, it suggests the downtrend is gaining strength.
Combining with ATR (Average True Range)
The ATR (Average True Range) is an indicator that measures price volatility and is effective for capturing changes in volatility. A high ATR value indicates high price volatility, while a low value suggests low volatility. If the ADX is rising and the ATR value is also increasing, it’s highly likely that a strong trend is developing. Using the ATR can further improve the accuracy of your entry points.
Benefits of Combining ADX with Other Indicators
By combining the ADX with tools like Bollinger Bands, moving averages, and ATR, you can get a more detailed picture of a trend’s direction and strength, which strengthens the basis for your trading decisions. Using multiple indicators creates a synergistic effect that you can’t get from a single indicator alone, and it’s particularly useful for accurately timing entries and exits in trending markets.
7. Summary and Key Takeaways: How to Effectively Use the ADX Indicator
The ADX indicator is an extremely effective tool for understanding trend strength and is a reliable metric for traders who use trend-following strategies. In this article, we’ve covered everything from the basics of using ADX and DMI to improving accuracy by combining them with other indicators. Here is a summary of the most important points and considerations when using the ADX.
Advantages of ADX
- Gauges Trend Strength: A key feature of the ADX is that it visually indicates the “strength” of a trend, not its direct direction. When the value is above 25, it confirms a strong trend is in place, strengthening the rationale for your entry timing.
- Combines with Other Indicators: By using ADX and DMI with other indicators like moving averages, Bollinger Bands, and ATR, you can make more confident trading decisions. Combining these metrics enhances the accuracy of your entries and exits.
Important Considerations When Using ADX
- False Signals on Short Timeframes: The ADX is generally recommended for use on longer timeframes (15-minute charts or higher), as false signals are more common on shorter timeframes. It’s more difficult to judge trends on short timeframes due to frequent price fluctuations, which can lead to misinterpretations.
- Accurately Time Your Entries: Don’t just enter a trade as soon as the ADX starts to rise. It’s smart to also check the +DI and -DI crosses and the movements of other indicators before entering. This helps you avoid false signals and make more confident entries.
- Don’t Miss the End of a Trend: When the ADX starts to flatten or decline, it is likely that the trend is ending, making it a good time to consider taking profits. Furthermore, checking for divergence can help you prepare for a potential trend reversal.
Final Thoughts
The ADX is a crucial indicator for any trend-following strategy, but to get the most out of it, you must combine it with other indicators and analysis methods. By flexibly adapting your approach to market conditions, observing the ADX’s movements, and strictly managing your risk, you can significantly improve your trading accuracy.
References
DMIは、+DIと-DI、ADXという3本のラインから構成されるテクニカル指標で、相場のトレンドの有無や強弱を分析するこ…