- 1 1. What is the ZigZag Indicator
- 2 2. ZigZag Parameter Settings
- 3 3. How to Display ZigZag and Setup Steps
- 4 4. Trading Methods Using ZigZag
- 5 5. Advantages and Cautions of ZigZag
- 6 6. Practical Examples Using ZigZag
- 7 7. Summary
- 8 Reference Sites
1. What is the ZigZag Indicator
The ZigZag indicator is used in financial markets to visualize market movements and identify key trends and turning points. In particular, it emphasizes significant price movements and eliminates noise, making it easier to capture the direction of the trend. This section provides a detailed explanation of the ZigZag indicator’s overview and basic functions.
Basic Overview of the ZigZag Indicator
The ZigZag indicator is built into the MT4 (MetaTrader 4) platform and draws zigzag lines on the chart to visually indicate the flow of trends and reversal points. Because it only draws lines when a certain price movement occurs, it does not react to minor price changes, making it easier to visually capture only the major trends.
Primary Uses
The primary uses of the ZigZag indicator are as follows.
- Trend Confirmation: Makes it easier to visually determine the direction of uptrends and downtrends.
- Finding Entry Points: Use the points where significant price movements are indicated to search for entry and exit points.
- Noise Elimination: By ignoring small price fluctuations, focus on the turning points of major trends.
Standard Inclusion in MT4
MT4 comes with the ZigZag indicator built-in, so you can use it without any additional downloads or settings. Because it is easy to set up even for beginners, many traders use ZigZag to quickly grasp price movements. ZigZag is not only visually intuitive but also captures trends with simple operation, making it popular among both novice and advanced analysts.


2. ZigZag Parameter Settings
To effectively use the ZigZag indicator, correct parameter settings are essential. ZigZag primarily has three settings: “Depth”, “Deviation”, and “Backstep”, each serving a different role. This section explains the meaning and role of each parameter and recommends settings based on trading style.
Meaning and Role of Each Parameter: Depth, Deviation, Backstep
Depth (Depth)
Depth is the parameter that sets the minimum price movement required to draw the zigzag line. If the difference between the high and low does not meet the specified value, that portion is not drawn as a ZigZag line. Setting Depth to a small value reflects even minor movements, but can increase noise and make the trend harder to read. Conversely, a larger Depth value extracts only the main trend, reducing noise and resulting in a visually simpler chart.
Deviation (Deviation)
Deviation is the threshold that the ZigZag indicator uses to recognize a trend reversal. The ZigZag line changes direction only when the price moves beyond this threshold. Setting Deviation to a higher value suppresses reversals even with larger price movements, emphasizing the main trend. Conversely, a lower Deviation makes it more responsive to small fluctuations.
Backstep (Backstep)
Backstep specifies the number of bars before the indicator is drawn. This setting determines over what span of price movement the line is plotted. A short Backstep setting reacts quickly and responds to small fluctuations, but may react too often and increase noise.
Default Settings and Their Explanation
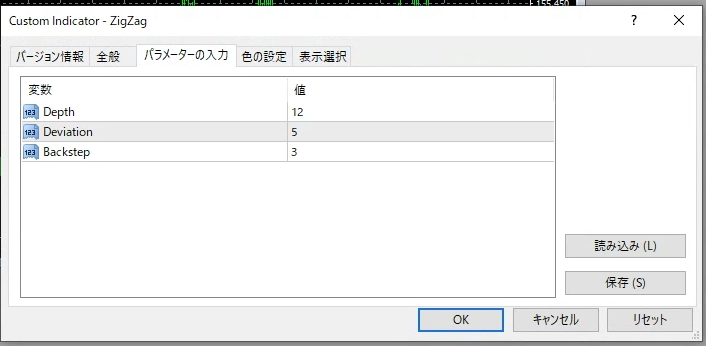
The default settings for the ZigZag indicator are as follows:
- Depth:12
- Deviation:5
- Backstep:3
These settings are considered optimal for capturing general trends, and beginners are recommended to start with the default values. The default values are designed to capture a certain level of trend while eliminating excessive noise.
Recommended Settings Based on Trading Style
By adjusting the ZigZag indicator settings according to your trading style, you can achieve more accurate market analysis. Below are recommended settings for each trading style:
- Day Trading: In day trading, you often want to capture short-term trends, so setting Depth to a smaller value (8–10) and Deviation slightly lower (3–4) is advisable.
- Swing Trading: For swing trading, you need to capture medium-term trend changes, so setting Depth larger (15–20) and Deviation to standard (5) or slightly higher is effective.
- Scalping: Scalping requires reacting to instant price movements, so setting Depth and Deviation very low (around 3–5) and keeping Backstep short is recommended.
3. How to Display ZigZag and Setup Steps
The steps to display the ZigZag indicator on MT4 are very simple. Here we provide a detailed explanation of how to display and configure the ZigZag indicator on MT4. We also introduce ways to further customize the ZigZag indicator.
Steps to Display the ZigZag Indicator on MT4
1. Preparing the Chart
Launch MT4 and open the chart of the currency pair you want to display. Since ZigZag can be applied to any time frame, choose your preferred time frame from 1‑minute to daily.
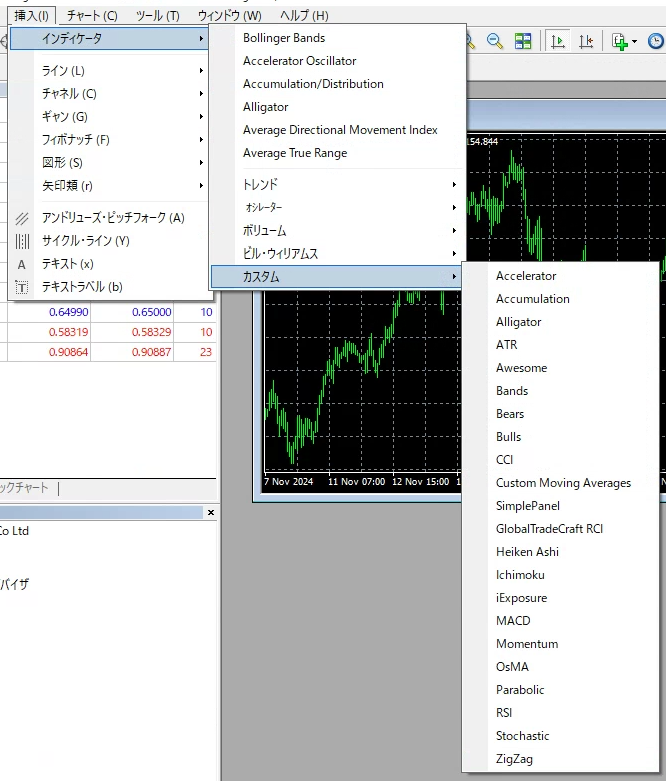
2. Inserting the Indicator
From the top menu in MT4, click “Insert” and select “Indicators.” Then expand the “Custom” menu and click “ZigZag.” This will display the ZigZag indicator settings window.
3. Setting Parameters
In the displayed settings window, enter the Depth, Deviation, and Backstep parameters. If you are using it for the first time, we recommend using the default settings. If you want to customize the settings to match your trading style, refer to the previous section “2. ZigZag Parameter Settings.”
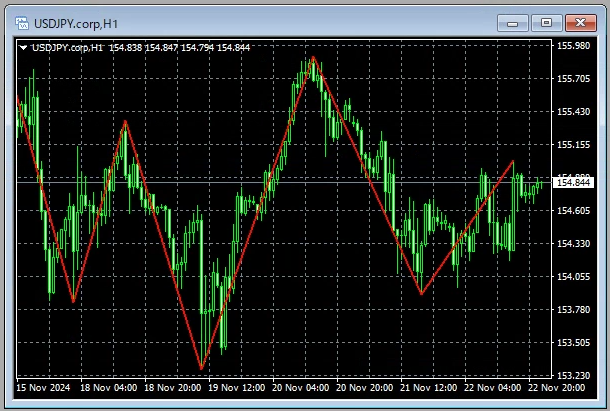
4. Reflecting on the Chart
Once the settings are complete, click “OK” and the ZigZag indicator will be drawn on the chart. The line will be drawn in a zigzag pattern, allowing you to visually confirm the major highs and lows.
How to Set Parameters
After displaying the ZigZag indicator, if you want to change the settings, you can reconfigure the parameters using the following steps.
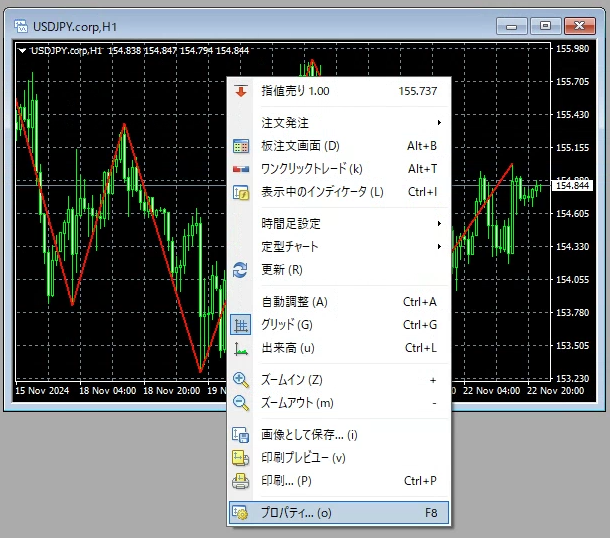
1. Open ZigZag Properties
Right‑click the ZigZag line on the chart and select “Properties.”
2. Reconfigure Parameters
Adjust the Depth, Deviation, and Backstep items again to achieve your desired trend display.
3. Confirm Settings
Once the changes are complete, click “OK” to save the changes. The ZigZag line will be drawn based on the new parameters.
How to Add Custom Indicators
In MT4, you can add more feature‑rich custom indicators to the ZigZag indicator. Here we introduce how to install custom indicators.
- Obtaining the Indicator File
Download the custom ZigZag indicator (e.g., an indicator that triggers alerts under specific conditions) available online. The file format is usually .ex4 or .mq4. - Copying to the MT4 Folder
Copy the downloaded file to “MT4 installation folder → MQL4 → Indicators.” - Restarting MT4
Close MT4 and restart it. This will allow MT4 to recognize the copied custom indicator. - Displaying the Custom Indicator
After restarting MT4, drag the custom ZigZag indicator from the Navigator window’s “Indicators” list onto the chart.

4. Trading Methods Using ZigZag
The ZigZag indicator is useful for identifying trends and pinpointing entry points, so many traders incorporate it into their trading strategies. Here we explain specific trading methods that use the ZigZag indicator. We also touch on how to maximize its effectiveness by combining it with other indicators.
How to Identify Trends and Entry Points
Drawing Trend Lines
You can draw trend lines in the market using the zigzag lines plotted by the ZigZag indicator. In an uptrend, connect the lows drawn by the ZigZag to form the trend line; in a downtrend, connect the highs. Using these trend lines as a guide, you can visually capture the market’s direction.
Finding Entry Points
If you determine that the trend is continuing, it is effective to enter at pullback buys or retracement sells by checking the next low or high. For example, during an uptrend when the ZigZag shows a new low, a pullback buy at that point can be effective. Conversely, in a downtrend, a retracement sell entry is appropriate.
Combining with Other Indicators
Combining with Stochastics
Combining the ZigZag indicator with Stochastics allows you to confirm trend strength while finding more precise entry points. For instance, when the ZigZag indicates a low and the Stochastics are in the oversold zone, the signal for a bullish reversal becomes more reliable.
Combining with Dow Theory
Using the ZigZag indicator in conjunction with Dow Theory’s basic principles lets you determine trend direction more reliably. In Dow Theory, an uptrend is defined by successive higher highs and higher lows; the ZigZag indicator leverages this characteristic to make it easier to confirm whether the trend is continuing.
Combining with Moving Averages (MA)
Combining moving averages with the ZigZag indicator improves entry precision. For example, display a short‑term and a long‑term moving average; when the ZigZag updates a low or high and the moving averages cross, it can be used as a signal that a trend reversal is likely.
Using the Meril Pattern
A special method that uses the ZigZag indicator is the “Meril Pattern.” This pattern predicts reversal points from the shape of the zigzag, mainly used to locate the end or turning point of a trend. In the Meril Pattern, when the ZigZag’s highs and lows form a specific shape (e.g., head‑and‑shoulders or double top), it often suggests a trend reversal. Finding this pattern makes it easier to enter or exit when the trend ends.
5. Advantages and Cautions of ZigZag
The ZigZag indicator is a useful tool for traders, but it is important to understand its characteristics and use it correctly. Here, we will explain in detail the main advantages of the ZigZag indicator and the points to be careful about when using it.
Advantages of ZigZag
1. Visually grasp the overall market trend
The biggest advantage of the ZigZag indicator is that it can easily visualize the overall trend on the chart. By removing noise from small price fluctuations and emphasizing only the significant highs and lows, it becomes easier to discern the trend direction and turning points. This makes trend assessment easier, and many traders from beginners to advanced users employ it.
2. Easy to find trend reversal points
The ZigZag indicator helps capture trend reversal points by visualizing price up and down movements. Especially in trading strategies that target pullbacks or retracements, it makes it easier to find trend reversal points, aiding in timing entry and exit points.
3. Easy to combine with other indicators
By combining the ZigZag indicator with other indicators such as Stochastics or moving averages, you can increase the accuracy of entry points. It also pairs well with theories that explain price movements, such as Dow Theory or Meril Patterns, allowing for greater diversity in trading strategies.
Cautions Regarding ZigZag
1. Be cautious when using in range‑bound markets
The ZigZag indicator is particularly effective in trending markets, but tends to produce more noise in range‑bound markets. When price moves in small increments within a fixed range, ZigZag may frequently indicate direction changes, making it difficult to determine the trend direction. Therefore, caution is needed when using it in range‑bound markets. In such cases, it is advisable to combine ZigZag with range‑sensitive indicators such as Bollinger Bands.
2. Display changes significantly based on parameter settings
The display of the ZigZag indicator changes significantly depending on parameters such as Depth, Deviation, and Backstep. Incorrect parameter settings can fail to accurately reflect the actual trend movements, resulting in increased noise or missed important turning points. It is essential to set parameters appropriately based on your trading style and the market conditions you wish to analyze.
3. Be aware of the repaint phenomenon
The ZigZag indicator has a characteristic called “repainting.” Repainting refers to the phenomenon where past data is updated and the drawn lines change in response to price movements. While this allows for re‑evaluation of past trends, it can make real‑time decisions difficult. When trading, consider the impact of repainting and use other indicators or support lines to make entry and exit decisions.
Changes in Display Due to Parameter Settings and Their Impact
It is also important to understand how the display changes when you modify the ZigZag indicator’s parameters. Increasing the Depth or Deviation values will display only major trend changes and filter out fine noise, but may cause you to miss turning points from small price fluctuations. Conversely, setting Depth or Deviation to smaller values will make the indicator react to small price movements, making it easier to capture short‑term trends, but it also increases noise, so caution is needed.
6. Practical Examples Using ZigZag
The ZigZag indicator is essential to understand how it can be useful in actual trading. Here, we introduce tips to improve trading accuracy through trade scenarios using ZigZag, and analysis of success and failure cases.
Specific Trade Scenarios and Their Outcomes
1. Buying on Pullbacks in an Uptrend
If the ZigZag draws a new high from a low to a high, it indicates that the uptrend is continuing. In this scenario, targeting the next pullback (price dip) for entry is effective. For example, after the ZigZag marks a low, if the subsequent low is higher than the previous one, that point becomes a pullback entry opportunity.
Result: Entering this way allows you to trade in line with the trend, making it easier to target profits.
2. Selling on Retracements in a Downtrend
Conversely, if the ZigZag draws a zigzag from a high to a low, it indicates that a downtrend is ongoing. In this case, targeting the next retracement (price rise) for a sell entry is advisable. When the ZigZag creates a new low without updating the high, a retracement sell opportunity aligned with the trend emerges.
Result: This allows you to enter without going against the trend, aiming for profit while keeping risk in check.
Analysis of Success and Failure Cases
Success Case: Capturing a Trend Reversal
In one currency pair, an uptrend was ongoing, but we chose not to enter when the ZigZag began drawing a new low. Later, the ZigZag formed a downward wave, signaling a shift to a downtrend, so we waited for another pullback before entering. As a result, we captured the trend reversal beautifully and earned profits.
Key Point: Waiting without missing the moment the ZigZag wave starts to change was the factor for success.
Failure Case: Entry in a Range Market
In a range-bound market, we saw the ZigZag frequently reversing direction and reacted to short-term waves, entering only to have the price move against us before the trend settled. When the ZigZag oscillates in small increments, the trend direction is unclear, making false signals more likely.
Key Point: Entry in a range market is noisy, and relying solely on ZigZag proved to be high risk.
Tips for Trading with ZigZag
- Enter Only in Trend Markets
ZigZag is an indicator that performs best in trending markets. In range-bound markets, noise is high and entry timing is difficult, so use it when the trend is clear. - Combine with Other Indicators to Increase Accuracy
Because ZigZag alone can produce false signals, combining it with moving averages, stochastic oscillators, etc., can increase the reliability of entry points. - Be Careful of Repainting
Because ZigZag lines can be altered by price changes, when making entry decisions, you should consider not only the real-time waveform but also other information, and proceed cautiously.
7. Summary
The ZigZag indicator is a useful tool that helps grasp the overall trend of the market and identify trade entry points. Its simple display and ease of use make it a favorite among many traders. However, the ZigZag indicator has unique characteristics, and there are cautions such as repainting and noise in range markets, so proper parameter settings and combining with other indicators are important.
Reaffirming Effective Usage Methods
- Adjusting Parameter Settings
By appropriately setting Depth, Deviation, and Backstep parameters according to your trading style and market conditions, you can maximize the effectiveness of the ZigZag. In particular, setting them to match a trending market reduces noise and makes it easier to capture key trend reversal points. - Using in Trending Markets and Combining with Other Indicators
The ZigZag indicator performs best in markets with clear trends. In particular, combining it with other indicators such as Stochastics or moving averages can reduce false signals and improve trade accuracy. - Be Cautious of Range Markets and Repainting Phenomena
Using the ZigZag in range markets can increase noise, so handle it carefully. Also, because of its repainting nature, past data may change, so don’t rely too heavily on real-time waveforms; instead, refer to the overall trend and other support information.
Advice for Readers
The ZigZag indicator is a great tool for visually grasping market flow, but it is not a silver bullet. Combining it with other indicators and analysis methods, and finding the optimal usage that fits your trading style, is key to long-term trading success. Additionally, ZigZag is suitable for reviewing past market conditions, so we recommend understanding its characteristics through backtesting and other means, so you can use it confidently.
Reference Sites
金融コンサルティング会社アセンダントの代表取締役でもある山中康司氏による監修記事です。相場の流れを自動的に視覚化するZi…
ここで為替相場の流れが変わる!?FXトレーダーが意識する『時間分析』を解説…