What is the Rank Correlation Index (RCI)?
The Core Concept of RCI
The Rank Correlation Index (RCI) is a technical indicator used to analyze price trend fluctuations in financial markets. It evaluates the current price relative to past prices by calculating the rank correlation coefficient. The RCI helps traders gauge the strength and direction of a trend, assisting in identifying potential entry and exit points.
How to Calculate RCI
RCI calculation is based on ranking price data over a specific period. First, collect a set of price data over a defined timeframe and rank each data point in ascending order based on its price. Next, calculate the correlation between the rank of the current price and the ranks of past prices. This correlation becomes the RCI value. The RCI value ranges from -100 to 100, with positive values indicating an uptrend and negative values indicating a downtrend.
RCI vs. Other Trend Indicators
Unlike other trend indicators like the RSI or Bollinger Bands, the RCI is unique because it is based on price rankings. The RSI measures the magnitude of recent price changes to determine overbought/oversold conditions, while Bollinger Bands show the range of price fluctuations based on standard deviation. The RCI analyzes trends from a different perspective, offering a clearer view of a trend’s strength and direction.

How to Set RCI Parameters
Setting Basic Parameters
When using the RCI, parameter settings are crucial. The RCI has two main parameters: period setting and level setting. The period setting determines the number of data points used to calculate the RCI, typically using values like 14, 20, or 28. The level setting indicates the thresholds where a trend’s strength or direction is considered to have changed. Commonly, levels like +70 and -70 are used.
Customizing Settings
This section explains how to customize RCI settings for different trading styles, along with specific examples. For instance, short-term traders can use a shorter period (e.g., 14 periods) and lower levels (e.g., ±50) to react quickly to sudden trend changes. Long-term traders can use a longer period (e.g., 28 periods) and higher levels (e.g., ±70) to capture significant trend shifts.
Setting and Using Alert Functions
Learn how to set up alerts to monitor RCI fluctuations on MT4/MT5 platforms. Setting up alerts allows you to receive notifications when the RCI value crosses a specific level. This helps you quickly detect trend changes and execute trades at the right time. For example, you can set an alert for a buy signal when the RCI goes above +70 or a sell signal when it drops below -70.
Trading Strategies Using RCI
How to Spot Buy Signals with RCI
Here are some specific examples of how to effectively find buy signals and the best entry points using the RCI. A buy signal can be identified when the RCI transitions from a downtrend to an uptrend after a previous uptrend. You can also consider a buy signal to be generated when the RCI value crosses a specific level, such as +70. Furthermore, a buy signal is considered stronger when the RCI indicates an uptrend while the price simultaneously breaks through a support line.
How to Spot Sell Signals with RCI
This section explains how to use the RCI to find the optimal timing for sell entries and shares tips to improve trading accuracy. A sell signal can be identified when the RCI transitions from an uptrend to a downtrend after a previous downtrend. You can also consider a sell signal to be generated when the RCI value drops below a specific level, such as -70. Additionally, a sell signal is considered stronger when the RCI indicates a downtrend while the price falls below a resistance line.
Combining RCI with Other Indicators
Learn how to achieve more effective trades by combining the RCI with other technical indicators like Bollinger Bands or moving averages. For example, when the RCI indicates an uptrend and the Bollinger Bands are contracting, there’s a possibility of a strong upcoming uptrend. Conversely, if the RCI indicates a downtrend and the Bollinger Bands are expanding, the downtrend might be strengthening. When combined with moving averages, a buy signal is reinforced if the RCI shows an uptrend and the price is above the moving average.

Precautions When Using RCI
Risks of Using RCI
Risk management is vital in trading. This section explains the potential risks and countermeasures when using the RCI. Since the RCI is calculated based on historical price data, past data does not always reflect future prices. Also, the RCI is a tool to indicate trend strength and direction, but it should not be the sole indicator for determining entry and exit points. Combining it with other technical indicators and fundamental analysis can mitigate risks and build a more reliable trading strategy.
Checklist to Avoid Mistakes
Here is a practical checklist to help beginners avoid common mistakes when using the RCI. Incorrect settings or misinterpreting RCI values can lead to bad trades. Use this checklist to stay on track:
1. Verify RCI settings. Ensure the period and level settings are appropriate.
2. Interpret RCI values correctly. Understand that RCI indicates trend strength and direction, and always use it in conjunction with other technical and fundamental analysis.
3. Be mindful of RCI value fluctuations. Avoid making emotional judgments when the RCI value changes significantly.
The Influence of Trading Psychology
Managing your psychological state is essential for trading success. This section introduces the psychological factors involved in using RCI and how to overcome them. Significant fluctuations in RCI values can lead to emotional decisions. For example, a sharp rise in RCI might cause excitement, leading to a hasty buy order. Conversely, a sharp drop might trigger fear, leading to a sell order. Such emotional decisions can lead to trading failures. It is crucial to stay calm and objectively assess RCI values. To achieve this, pre-set risk management rules and stick to them. It is also effective to keep a trading journal to objectively analyze your own trades.
Conclusion
Toward Effective Trading with RCI
The RCI is a valuable indicator that helps traders understand a trend’s strength and direction, assisting in determining entry and exit points. Using the RCI effectively can improve trading accuracy. However, the RCI is not a cure-all; combining it with other technical indicators and fundamental analysis will help you build a more robust trading strategy. When using the RCI, always prioritize risk management and avoid emotional decisions. With diligent practice, you can use the RCI to achieve stable profits.
History and Background of RCI
The RCI was developed in the 1990s by technical analyst Bill Williams. Williams, feeling the limitations of other trend indicators at the time, was looking for a more accurate method of trend analysis. He devised a new indicator based on price rankings and named it the RCI. Since its development, the RCI has been widely adopted by many traders and is recognized as a key indicator for trend analysis.
Advantages and Disadvantages of RCI
A key advantage of the RCI is its ability to clearly grasp a trend’s strength and direction. However, since the RCI is calculated based on historical price data, past data does not always reflect future prices. The RCI is an indicator of trend strength and direction, but it should not be the sole indicator for determining entry and exit points. Therefore, combining the RCI with other technical indicators and fundamental analysis can help you build a more reliable trading strategy.
Expert Opinion
A technical analyst states, “The RCI is a very effective indicator for understanding trend strength and direction, but it is crucial to combine it with other technical indicators. RCI alone is not sufficient to determine trading signals.”
Practical Example of RCI Use
For example, a trader used the RCI to analyze the trend of the USD/JPY currency pair. The trader placed a buy order when the RCI went above +70 and a sell order when it fell below -70. As a result, the trader was able to achieve stable profits using the RCI.

Free RCI Indicator
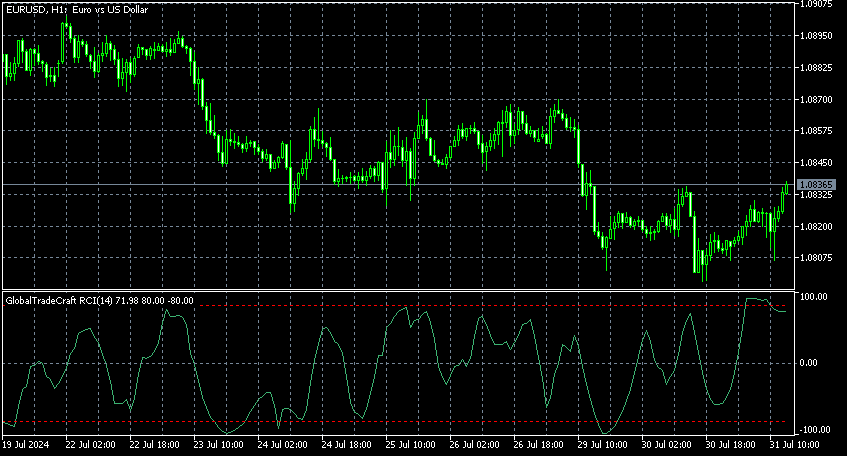
Since the MT4 and MT5 platforms do not include a standard RCI indicator, you can use our proprietary “GlobalTradeCraft RCI.” The download file is a password-protected zip format.
Download Link
Indicator Name: GlobalTradeCraft RCI
Download Password: 免責事項を読みました
zip password: GTC-RCI-2024
Note: The download password is in Japanese characters.
Disclaimer:
We are not responsible for any damages or issues that may arise from the use of this indicator. Please use it at your own risk.
Using this indicator will make your trading on MT4 and MT5 even more efficient.
References
RCI(順位相関係数)とは、相場の過熱感を判断するオシレーター系のテクニカル指標です。本記事では、RCIの意味や見方、活…

RCIとは、FXのテクニカル指標の一つです。一般的に売られすぎや買われすぎを判断する際に使います。本記事ではRCIの意味…