रैंक कोरिलेशन इंडेक्स (RCI) क्या है?
RCI का मूल सिद्धांत
रैंक कोरिलेशन इंडेक्स (RCI) एक तकनीकी संकेतक है जिसका उपयोग वित्तीय बाजारों में मूल्य प्रवृत्ति के उतार‑चढ़ाव का विश्लेषण करने के लिए किया जाता है। यह वर्तमान मूल्य की तुलना पिछले मूल्यों से रैंक कोरिलेशन कोएफ़िशिएंट की गणना करके करता है। RCI ट्रेडरों को प्रवृत्ति की ताकत और दिशा का आकलन करने में मदद करता है, जिससे संभावित प्रवेश और निकास बिंदुओं की पहचान आसान हो जाती है।
RCI की गणना कैसे करें
RCI की गणना एक विशिष्ट अवधि में मूल्य डेटा को रैंक करने पर आधारित होती है। पहले, निर्धारित समय‑सीमा में मूल्य डेटा का एक सेट एकत्र करें और प्रत्येक डेटा पॉइंट को उसके मूल्य के आधार पर आरोही क्रम में रैंक दें। फिर, वर्तमान मूल्य के रैंक और पिछले मूल्यों के रैंकों के बीच सहसंबंध की गणना करें। यह सहसंबंध ही RCI मान बनाता है। RCI मान -100 से 100 तक हो सकता है, जहाँ सकारात्मक मान अपट्रेंड और नकारात्मक मान डाउनट्रेंड दर्शाते हैं।
RCI बनाम अन्य ट्रेंड संकेतक
RSI या Bollinger Bands जैसे अन्य ट्रेंड संकेतकों के विपरीत, RCI अद्वितीय है क्योंकि यह मूल्य रैंकिंग पर आधारित है। RSI हालिया मूल्य परिवर्तनों की मात्रा को मापकर ओवरबॉट/ओवरसोल्ड स्थितियों का निर्धारण करता है, जबकि Bollinger Bands मानक विचलन के आधार पर मूल्य उतार‑चढ़ाव की सीमा दिखाते हैं। RCI एक अलग दृष्टिकोण से प्रवृत्तियों का विश्लेषण करता है, जिससे प्रवृत्ति की ताकत और दिशा का स्पष्ट दृश्य मिलता है।

RCI पैरामीटर कैसे सेट करें
बुनियादी पैरामीटर सेट करना
RCI का उपयोग करते समय पैरामीटर सेटिंग्स अत्यंत महत्वपूर्ण होती हैं। RCI के दो मुख्य पैरामीटर होते हैं: अवधि सेटिंग और स्तर सेटिंग। अवधि सेटिंग यह निर्धारित करती है कि RCI की गणना के लिए कितने डेटा पॉइंट्स उपयोग किए जाएंगे, आमतौर पर 14, 20 या 28 जैसे मानों का उपयोग किया जाता है। स्तर सेटिंग यह दर्शाती है कि कब प्रवृत्ति की ताकत या दिशा में परिवर्तन माना जाता है। सामान्यतः +70 और -70 जैसे स्तर उपयोग किए जाते हैं।
सेटिंग्स को कस्टमाइज़ करना
यह अनुभाग विभिन्न ट्रेडिंग शैलियों के लिए RCI सेटिंग्स को कैसे कस्टमाइज़ किया जाए, इसे विशिष्ट उदाहरणों के साथ समझाता है। उदाहरण के लिए, अल्पकालिक ट्रेडर छोटे अवधि (जैसे 14 अवधि) और निम्न स्तर (जैसे ±50) का उपयोग करके अचानक प्रवृत्ति परिवर्तन पर जल्दी प्रतिक्रिया दे सकते हैं। दीर्घकालिक ट्रेडर बड़े अवधि (जैसे 28 अवधि) और उच्च स्तर (जैसे ±70) का उपयोग करके महत्वपूर्ण प्रवृत्ति बदलावों को पकड़ सकते हैं।
अलर्ट फ़ंक्शन सेट करना और उपयोग करना
MT4/MT5 प्लेटफ़ॉर्म पर RCI उतार‑चढ़ाव की निगरानी के लिए अलर्ट कैसे सेट करें, सीखें। अलर्ट सेट करने से आप तब सूचनाएँ प्राप्त कर सकते हैं जब RCI मान किसी विशिष्ट स्तर को पार करता है। यह आपको प्रवृत्ति परिवर्तन को जल्दी पहचानने और सही समय पर ट्रेड निष्पादित करने में मदद करता है। उदाहरण के लिए, आप +70 से ऊपर जाने पर खरीद संकेत के लिए या -70 से नीचे गिरने पर बिक्री संकेत के लिए अलर्ट सेट कर सकते हैं।
RCI का उपयोग करके ट्रेडिंग रणनीतियाँ
RCI के साथ खरीद संकेत कैसे पहचानें
यहाँ कुछ विशिष्ट उदाहरण दिए गए हैं कि RCI का उपयोग करके खरीद संकेत और सर्वोत्तम प्रवेश बिंदु कैसे खोजें। जब RCI एक डाउनट्रेंड से अपट्रेंड में बदलता है, विशेषकर पहले के अपट्रेंड के बाद, तो इसे खरीद संकेत माना जा सकता है। आप यह भी मान सकते हैं कि जब RCI मान किसी विशिष्ट स्तर, जैसे +70, को पार करता है, तो यह खरीद संकेत उत्पन्न करता है। इसके अलावा, जब RCI अपट्रेंड दर्शाता है और मूल्य एक साथ समर्थन रेखा को तोड़ता है, तो खरीद संकेत और भी मजबूत माना जाता है।
RCI के साथ बिक्री संकेत कैसे पहचानें
यह अनुभाग बताता है कि RCI का उपयोग करके बिक्री प्रवेश के लिए सर्वोत्तम समय कैसे निर्धारित करें और ट्रेडिंग सटीकता बढ़ाने के टिप्स साझा करता है। जब RCI एक अपट्रेंड से डाउनट्रेंड में बदलता है, विशेषकर पहले के डाउनट्रेंड के बाद, तो इसे बिक्री संकेत माना जा सकता है। आप यह भी मान सकते हैं कि जब RCI मान किसी विशिष्ट स्तर, जैसे -70, से नीचे गिरता है, तो यह बिक्री संकेत उत्पन्न करता है। अतिरिक्त रूप से, जब RCI डाउनट्रेंड दर्शाता है और मूल्य एक साथ प्रतिरोध रेखा के नीचे गिरता है, तो बिक्री संकेत अधिक मजबूत माना जाता है।
RCI को अन्य संकेतकों के साथ संयोजित करना
Learn how to achieve more effective trades by combining the RCI with other technical indicators like Bollinger Bands or moving averages. For example, when the RCI indicates an uptrend and the Bollinger Bands are contracting, there’s a possibility of a strong upcoming uptrend. Conversely, if the RCI indicates a downtrend and the Bollinger Bands are expanding, the downtrend might be strengthening. When combined with moving averages, a buy signal is reinforced if the RCI shows an uptrend and the price is above the moving average.

Precautions When Using RCI
Risks of Using RCI
Risk management is vital in trading. This section explains the potential risks and countermeasures when using the RCI. Since the RCI is calculated based on historical price data, past data does not always reflect future prices. Also, the RCI is a tool to indicate trend strength and direction, but it should not be the sole indicator for determining entry and exit points. Combining it with other technical indicators and fundamental analysis can mitigate risks and build a more reliable trading strategy.
Checklist to Avoid Mistakes
Here is a practical checklist to help beginners avoid common mistakes when using the RCI. Incorrect settings or misinterpreting RCI values can lead to bad trades. Use this checklist to stay on track:
1. Verify RCI settings. Ensure the period and level settings are appropriate.
2. Interpret RCI values correctly. Understand that RCI indicates trend strength and direction, and always use it in conjunction with other technical and fundamental analysis.
3. Be mindful of RCI value fluctuations. Avoid making emotional judgments when the RCI value changes significantly.
The Influence of Trading Psychology
Managing your psychological state is essential for trading success. This section introduces the psychological factors involved in using RCI and how to overcome them. Significant fluctuations in RCI values can lead to emotional decisions. For example, a sharp rise in RCI might cause excitement, leading to a hasty buy order. Conversely, a sharp drop might trigger fear, leading to a sell order. Such emotional decisions can lead to trading failures. It is crucial to stay calm and objectively assess RCI values. To achieve this, pre-set risk management rules and stick to them. It is also effective to keep a trading journal to objectively analyze your own trades.
Conclusion
Toward Effective Trading with RCI
The RCI is a valuable indicator that helps traders understand a trend’s strength and direction, assisting in determining entry and exit points. Using the RCI effectively can improve trading accuracy. However, the RCI is not a cure-all; combining it with other technical indicators and fundamental analysis will help you build a more robust trading strategy. When using the RCI, always prioritize risk management and avoid emotional decisions. With diligent practice, you can use the RCI to achieve stable profits.
History and Background of RCI
The RCI was developed in the 1990s by technical analyst Bill Williams. Williams, feeling the limitations of other trend indicators at the time, was looking for a more accurate method of trend analysis. He devised a new indicator based on price rankings and named it the RCI. Since its development, the RCI has been widely adopted by many traders and is recognized as a key indicator for trend analysis.
Advantages and Disadvantages of RCI
A key advantage of the RCI is its ability to clearly grasp a trend’s strength and direction. However, since the RCI is calculated based on historical price data, past data does not always reflect future prices. The RCI is an indicator of trend strength and direction, but it should not be the sole indicator for determining entry and exit points. Therefore, combining the RCI with other technical indicators and fundamental analysis can help you build a more reliable trading strategy.
Expert Opinion
एक तकनीकी विश्लेषक का कहना है, “RCI प्रवृत्ति की ताकत और दिशा को समझने के लिए एक बहुत प्रभावी संकेतक है, लेकिन इसे अन्य तकनीकी संकेतकों के साथ मिलाना आवश्यक है। केवल RCI अकेले ट्रेडिंग संकेत निर्धारित करने के लिए पर्याप्त नहीं है।”
RCI उपयोग का व्यावहारिक उदाहरण
उदाहरण के तौर पर, एक ट्रेडर ने USD/JPY मुद्रा जोड़ी की प्रवृत्ति का विश्लेषण करने के लिए RCI का उपयोग किया। ट्रेडर ने RCI +70 से ऊपर जाने पर खरीद आदेश दिया और -70 से नीचे गिरने पर बिक्री आदेश दिया। परिणामस्वरूप, ट्रेडर ने RCI का उपयोग करके स्थिर लाभ प्राप्त किया।

नि:शुल्क RCI संकेतक
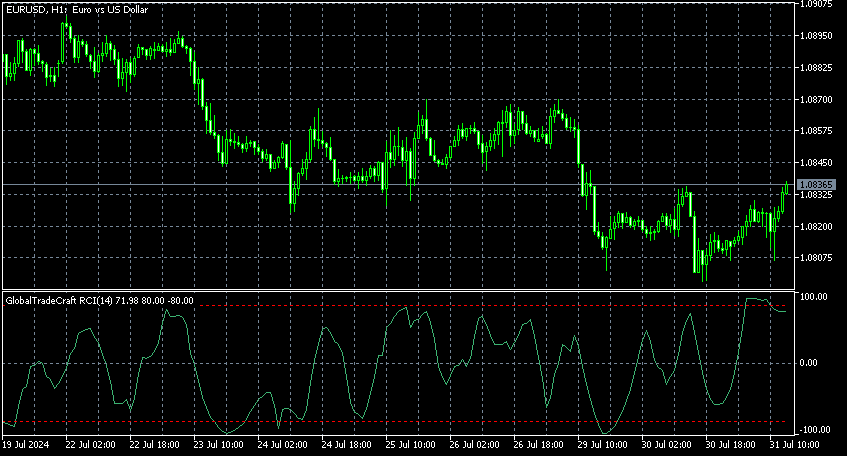
चूँकि MT4 और MT5 प्लेटफ़ॉर्म में मानक RCI संकेतक नहीं है, आप हमारे स्वामित्व वाले “GlobalTradeCraft RCI” का उपयोग कर सकते हैं। डाउनलोड फ़ाइल पासवर्ड‑सुरक्षित ज़िप फ़ॉर्मेट में है।
डाउनलोड लिंक
इंडिकेटर नाम: GlobalTradeCraft RCI
डाउनलोड पासवर्ड: 免責事項を読みました
ज़िप पासवर्ड: GTC-RCI-2024
नोट: डाउनलोड पासवर्ड जापानी अक्षरों में है।
अस्वीकरण:
हम इस संकेतक के उपयोग से उत्पन्न किसी भी नुकसान या समस्या के लिए ज़िम्मेदार नहीं हैं। कृपया इसे अपने जोखिम पर उपयोग करें।
इस संकेतक का उपयोग करने से आपका MT4 और MT5 पर ट्रेडिंग और भी अधिक कुशल हो जाएगा।
संदर्भ
RCI(順位相関係数)とは、相場の過熱感を判断するオシレーター系のテクニカル指標です。本記事では、RCIの意味や見方、活…

RCIとは、FXのテクニカル指標の一つです。一般的に売られすぎや買われすぎを判断する際に使います。本記事ではRCIの意味…


アヴァトレード・ジャパン:RCIとは?見方・使い方・買いシグナルについて
www.avatrade.co.jp