
The Relative Strength Index (RSI) is an important indicator in technical analysis. Traders and investors use the RSI to gauge market momentum and determine appropriate entry and exit points. This article will provide a detailed explanation of the RSI’s definition, features, interpretation, and practical trading strategies. By effectively using the RSI, you can expect to achieve more successful trades.
1. Unachoweza kusema RSI? Ufafanulo na Vipengele
Muhtasari wa RSI
The Relative Strength Index (RSI) is a popular technical indicator used to analyze market sentiment and investor behavior. It primarily helps traders assess whether a market is overbought or oversold, aiding in their decision-making for buying and selling. The RSI value ranges from 0 to 100, providing an assessment of the strength and direction of a market trend.
Jinsi ya Kuhesabu RSI
The RSI is calculated based on the magnitude of recent price gains versus recent price losses over a specified period. The standard period is 14 days, and the formula is as follows:

A high RSI value suggests the market is bullish, while a low value indicates a bearish sentiment. Specifically, an RSI value above 70 is generally considered “overbought,” and a value below 30 is considered “oversold.”
Vipengele Muhimu vya RSI
Asili ya Oscillator
As an oscillator, the RSI is highly responsive to market movements. This characteristic makes it very effective for understanding short-term market trends. It can also provide powerful signals, especially for contrarian strategies in a sideways or range-bound market.
Uwezo wa Kuwa Kipimo cha Kwanza
On the other hand, the RSI is a lagging indicator, meaning it follows price changes. This can sometimes lead to false signals during periods of sharp price movements. Therefore, it is advisable for traders to use the RSI in conjunction with other technical indicators for confirmation.
Vingizo Muhimu vya Ishara
A common method of using the RSI is to analyze its values against key thresholds, such as 70 and 30. An RSI above 70 is often seen as overbought, while a value below 30 is considered oversold. These thresholds are based on empirical observation, and many traders refer to them to make trading decisions. When the RSI crosses these lines, it is often seen as a potential sign of a market reversal.
Maelezo ya Kuangalia Wakati Unatumia RSI
The RSI is not a guarantee of high win rates, as it can be easily influenced by low market liquidity or external factors. When developing a trading strategy, it is crucial to consider not only the RSI signals but also the broader market conditions and relevant news. A comprehensive approach is essential for making sound judgments.


2. Jinsi ya Tafsiri na Kutumia RSI
The Relative Strength Index (RSI) is an oscillator-based indicator used to gauge market momentum and determine overbought or oversold conditions. Here, we will explain in detail how to interpret and effectively use the RSI.
2.1 Tafsiri ya Thamani za RSI
The RSI fluctuates within a range of 0% to 100%. The values are typically interpreted as follows:
- Juu ya 70% : Hali ya kuzidi kununuliwa. Wakati RSI inapita kiwango hiki, kuna uwezekano mkubwa wa kubadilika kwa soko.
- Chini ya 30% : Hali ya kuzidi kumalizika. Wakati RSI inapungua chini ya kiwango hiki, inaweza kuonyesha kuongezeka kwa soko kinachokuja.
This allows traders to identify potential entry points for a contrarian strategy.
2.2 Maombi ya Vitendo ya RSI katika Biashara
The RSI is primarily used in two types of strategies:
2.2.1 Biashara ya Kupinga Mwelekeo (Counter-Trend)
You can consider taking a short position when the RSI is above 70% or a long position when it is below 30%. Counter-trend trading is particularly effective in range-bound markets, but be cautious of false signals that can occur during strong trends.
2.2.2 Biashara ya Kubikuti Mwelekeo
By paying attention to the 50% centerline of the RSI, you can also take trend-following positions. When the RSI moves above 50%, it’s considered an uptrend, and you can enter a long position. Conversely, when it drops below 50%, it signals a downtrend, and you can take a short position. This method is effective when a trend is strong.
2.3 Visualizing the RSI
Most trading platforms allow you to display the RSI as a sub-window. This makes it easy to simultaneously track the RSI’s movement and price action in real-time. By observing the upward and downward movements of the RSI, you can better time your entries and exits.
2.4 Using RSI Divergence
Divergence using the RSI is a very powerful trading signal. When the price sets a new high or low, but the RSI fails to follow suit, it can be interpreted as a signal for a market reversal. In such situations, it’s crucial to observe carefully and make cautious decisions about your buy and sell timing.
2.5 Adjusting RSI Settings
While the standard RSI setting is 14 periods, you can modify this duration based on your trading style and market conditions. For example, for short-term trading, you can use a 7- or 9-period setting to make the indicator more responsive to price movements. On the other hand, if you focus on long-term trends, you might try a setting of 21 periods or more.
To use the RSI effectively, it is essential to have a solid understanding of what its values mean and how they relate to market conditions. Find a usage that fits your trading style and preferences.
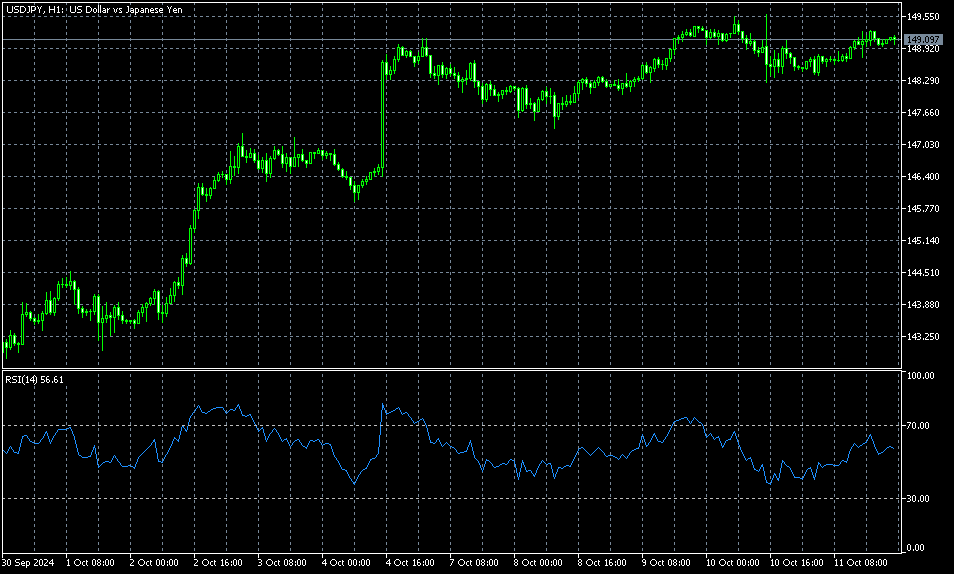
【Image】MT4 RSI
3. Fundamental RSI Trading Strategies
Trading methods that utilize the Relative Strength Index (RSI) are primarily divided into two scenarios: range-bound and trending markets. Understanding and applying these strategies will enable more effective trading. Here, we will provide a detailed explanation of fundamental strategies and how to implement them.
3.1 Contrarian Strategy in a Range-Bound Market
In a range-bound market, prices move within a defined range, making contrarian trading particularly effective. This method uses the RSI to measure market momentum and find suitable entry points.
- Sell Signal: When the RSI rises above 70%, the market is considered “overbought.” If the RSI then drops back below 70%, a price correction is likely to begin, presenting a selling opportunity.
- Buy Signal: Conversely, when the RSI falls below 30%, the market is considered “oversold.” If the RSI then rises back above 30, a price rebound can be expected, signaling a buying opportunity.
3.2 Trend-Following Strategy in a Trending Market
In a trending market, you can use the RSI to confirm the trend’s direction and apply a trend-following strategy. This approach provides effective trading opportunities by monitoring the RSI during an uptrend or a downtrend.
- Uptrend Entry: First, identify the RSI’s horizontal resistance line. When the RSI breaks above this line, it can be seen as a signal that an uptrend is beginning, and you can enter a long position. To increase the certainty of the trend, it is recommended to use other technical indicators as well.
- Downtrend Entry: Conversely, if the RSI breaks below its support line, it is a sign that a downtrend is beginning. In this case, you can consider entering a short position. It is important to monitor the trend’s continuation and take profits at the appropriate time.
3.3 Trading with Divergence
Divergence is a phenomenon where the RSI and price movements move in opposite directions, and it is a crucial signal that suggests a trend reversal. By using this signal, you can capture optimal entry points.
- Divergence ya Bullish: Divergence ya bullish hutokea wakati bei inafanya shio jipya, lakini RSI inaunda shio juu zaidi. Hii ni ishara kwamba shinikizo la kuuza linapungua, na kurudi nyuma kunaweza kuwa karibu.
- Divergence ya Bearish: Vinginevyo, divergence ya bearish hutokea wakati bei inafanya juu jipya, lakini RSI inaunda juu ya chini. Hii inaashiria kumalizika kwa uptrend, na unaweza kujiandaa kuingia katika nafasi fupi.
3.4 Umuhimu wa Stop-Loss na Usimamizi wa Hatari
Wakati wa biashara kwa kutumia RSI, kila wakati weka kiwango cha stop-loss na endesha usimamizi wa hatari wa kavu. Kumbuka hasa katika soko la mabadiliko, ishara za RSI hazijumuishi kila wakati, hivyo biashara ya tahadhari inahitajika. Kwa kufunga moja kwa moja nafasi yako katika kiwango cha stop-loss uliopangwa wakati bei inabadilika dhidi ya utabiri wako, unaweza kuzuia hasara kubwa. Hii itakuwezesha kufanya biashara kwa ujasiri zaidi.

4. Kuchanganya RSI na Viashiria vingine
Ingawa RSI (Kielelezo cha Nguvu ya Kuelezea) ni kiashiria cha manufaa sana kwa kujitegemea, kuchanganya na viashiria vingine kinaweza kuongeza ufanisi wake zaidi. Katika sehemu hii, tutasoma jinsi ya kuchanganya RSI na viashiria vingine ili kuboresha mkakati wako wa biashara.
4.1 Kuchanganya na MACD
Moving Average Convergence Divergence (MACD) ni kiashiria kinachotumika kupima nguvu ya mwelekeo. Kutumia RSI na MACD pamoja kunaweza kuboresha usahihi wa ishara zako. Kwa mfano, wakati RSI inapita juu ya 70% na MACD inabadilika chini, ni ishara thabiti ya kuuza. Vinginevyo, wakati RSI inapungua chini ya 30% na MACD inabadilika juu, ni ishara ya kununua. Kwa kuthibitisha ishara kutoka kwa viashiria vyote, unaweza kubaini kwa urahisi maeneo ya kuingia.
4.2 Kuchanganya na Bollinger Bands
Bollinger Bands ni kiashiria kinachoonyesha mabadiliko ya bei. Kwa kuchanganya RSI na Bollinger Bands, unaweza kutumia ishara ya juu/ chini ya ununuzi wa RSI kuthibitisha harakati za bei. Kwa maalum, ikiwa RSI ni chini ya 30% na bei inafikia Bollinger Band ya chini, inaweza kutafsiriwa kama ishara ya kununua. Kuchanganya hiki kinaweza kupelekea kuingia zaidi kwa kuaminika.
4.3 Kuchanganya na Moving Averages
Moving Averages (MA) ni viashiria vya msingi vinavyotumiwa kutambua mwelekeo. Kutumia RSI na MA pamoja kunakuwezesha kuthibitisha mwelekeo na kupunguza muda wa kuingia. Kwa mfano, ikiwa bei iko juu ya MA na RSI inapita juu ya 60%, unaweza kuzingatia kuingia katika nafasi ndefu, kwani inaashiria kuwa uptrend itasonga mbele. Kwa upande mwingine, ikiwa bei iko chini ya MA na RSI ni chini ya 40%, inaashiria nafasi fupi inayoweza kutokea.
4.4 Kuchanganya na Stochastics
Stochastics ni kiashiria cha oscillatory kingine kinachotumiwa kubaini hali ya juu/ chini ya ununuzi. Kuchanganya RSI na Stochastics kinaweza kuzalisha ishara za biashara zaidi nguvu. Kwa mfano, wakati viashiria vyote vinavyoonyesha ishara ya juu kwa wakati mmoja, kubadilika ni sana uwezekano, na kufanya iwe muda mzuri sana kuzingatia kuchukua nafasi.
4.5 Utekelezaji wa Kazi ili Kuongeza Ujuzi Wako
Kuajaribu viashiria tofauti vya RSI na viashiria vingine ni muhimu kwa kupata uzoefu. Kutumia backtesting kutathmini data za kihistoria kunaweza kukusaidia kugundua viashiria vinavyofanya kazi bora kwa mtindo wako wa biashara. Pia inashauriwa sana kufanya mazoezi kwa akaunti ya demo ili kujaribu viashiria tofauti bila hatari ya kifedha.
Ingawa RSI ni bora kwa kujitegemea, inakuwa zana yenye nguvu zaidi wakati inachanganywa na viashiria vingine. Tafuta viashiria sahihi kwa ajili yako ili kupanua mkakati wako wa biashara.
5. Mipangilio ya RSI na Vidokezo vya Kubinafsisha
Ili kutumia kwa ufanisi RSI (Kielelezo cha Nguvu ya Kuelezea), ni muhimu kuelewa mipangilio yake ya vigezo na jinsi ya kuyibadilisha. Sehemu hii inatoa mwongozo wa vitendo na mambo muhimu kuhusu mipangilio ya RSI.
5.1 Mipangilio ya Awali
The standard calculation period for the RSI is 14 periods. This setting was introduced by J.W. Wilder and is widely accepted. However, the optimal period can vary depending on your trading style and time frame, so it is important to adjust it to match your own preferences.
Suggested Examples:
- For short-term trading (scalping, day trading), a 9- or 5-period RSI is recommended.
- For long-term trading (swing trading, position trading), consider using a 22- or 42-period RSI.
5.2 Setting Key Thresholds
The typical RSI thresholds used are 70% and 30%, which indicate excessive buying or selling pressure. However, some traders who want a more sensitive response may set the RSI thresholds to 60% and 40%. This allows for more precise timing of entries and exits.
5.3 Visual Customization
To improve the visibility of the RSI, adjusting the line’s color and thickness can be very effective. It is particularly helpful to use different colors to distinguish between uptrends and downtrends. You can customize the color and style through the settings menu of your trading platform.
Specific Customization Example:
- Uptrend : Select a green line
- Downtrend : Select a red line
5.4 Implementing Alert Functions
When trading with the RSI, it is highly recommended to use alert functions. This allows you to react immediately when the RSI reaches a specific level. On platforms like MT4 and MT5, you can set up notifications when the RSI value reaches a specified threshold or a line is broken.
5.5 Regular Review
It is important to regularly review your RSI settings in accordance with market conditions. In strong trending markets, you might shorten the period to increase responsiveness. Conversely, in range-bound markets, using a slightly longer period can help reduce false signals.
Regular Testing
You should regularly check your trading results and continuously review whether your RSI settings are optimal. By consistently testing and adjusting, you can discover the best way to use the RSI for your personal trading style.

Summary
The RSI is a useful technical indicator for investors. However, to get more accurate trading signals, it’s best to use it in combination with other indicators rather than alone. It’s crucial to consider various factors, such as RSI settings, customization, and risk management, to adapt the indicator to your trading style. By regularly testing and adjusting your approach, you can establish an effective RSI-based strategy and aim for better trading results.
Frequently Asked Questions
What is RSI?
RSI (Relative Strength Index) is a prominent technical indicator that reflects the market’s psychological state. It ranges from 0 to 100, where a high value indicates an overbought market and a low value indicates an oversold market. Traders use this value as a reference to determine when to buy or sell.
How is RSI used?
RSI is mainly used in two strategies. One is a contrarian strategy, where a trader considers selling when the RSI exceeds 70% and buying when it drops below 30%. The other is a trend-following strategy, where a trader sees a break above the 50% line as a buying opportunity and a break below it as a selling opportunity. Traders often combine these methods, including the use of RSI divergence, to establish their own trading style.
What is the benefit of combining RSI with other indicators?
While RSI can be used on its own, combining it with other indicators like MACD, Bollinger Bands, or Moving Averages can increase the accuracy of your signals. When two or more indicators give a signal at the same time, it can be used as a more reliable entry point. It’s important to find the right combination that suits your trading style.
How should I adjust my RSI settings?
Mpangilio wa kawaida wa RSI ni kipindi 14, lakini unapaswa kuchagua kipindi kinachofaa kulingana na mtindo wako wa biashara. Mpangilio wa kipindi 9 au 5 unafaa kwa biashara fupi, wakati mpangilio wa kipindi 22 au 42 ni bora kwa biashara ndefu. Unaweza pia kubadilisha viwango vya jumla vya 70 % na 30 % kuwa 60 % na 40 %, kulingana na mapendeleo yako. Kuangalia na kurekebisha mipangilio yako mara kwa mara ili kuendana na hali za soko pia ni muhimu.